Optimism (OP) Skyrockets 11%—Bulls Charge Toward $1.20 in Crypto Rally

Layer 2's hottest token just flipped the switch to turbo mode. Optimism (OP) surges double-digits as traders pile into Ethereum's scaling darling.
The $1.20 Gambit
Chart patterns suggest this isn't just another dead cat bounce. The 11% pump cracks open a path to test resistance levels not seen since last quarter's meme coin mania.
Institutional FOMO or Retail Frenzy?
Whales are accumulating while degens chase the green candles—classic crypto theater. Meanwhile, Bitcoin maximalists mutter about 'alt season' between sips of their overpriced coffee.
The Bottom Line
Whether this holds or becomes another 'buy the rumor, sell the news' event depends on whether actual developers keep building... or if this is just another liquidity play by hedge funds who still don't understand gas fees.

This movement marks a potential turning point for the Layer-2 asset, which had previously been under sustained bearish pressure. With OP now trading at $0.65, technical signals suggest the possibility of a sustained breakout if key levels are maintained.
ZAYK Charts and @LTSTrading Signal Breakout from Long-Term Patterns
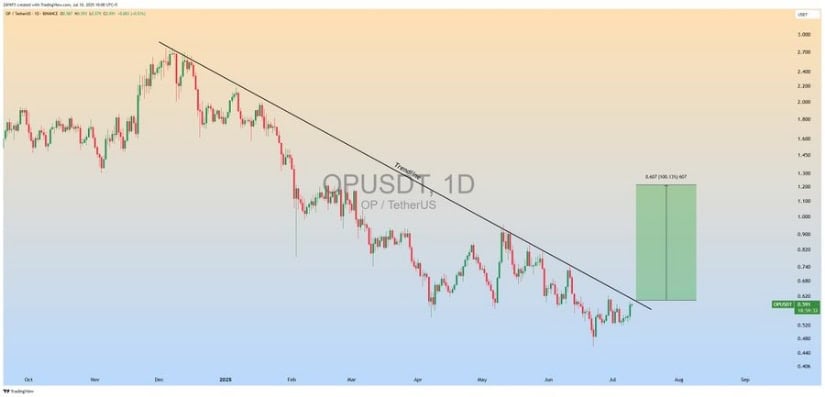
Analyst ZAYK Charts (@ZAYKCharts) has shared a chart highlighting a daily timeframe trendline breakout for OP/USDT. The descending resistance line, active since December 2023, has been tested several times and now appears to be breached, indicating a change in trend structure. Price has climbed decisively toward the breakout zone around $0.65, signaling a possible end to the downtrend.
Source: X
A projected move to $1.20 is mapped from the measured distance between the trendline and recent lows. According to the chart, confirmation of this setup requires OP to close above the trendline with sustained volume. A failure to hold the breakout could expose the token to a retest NEAR the $0.58–$0.60 area. The breakout structure, however, aligns with the strengthening technical signals seen in other timeframes.
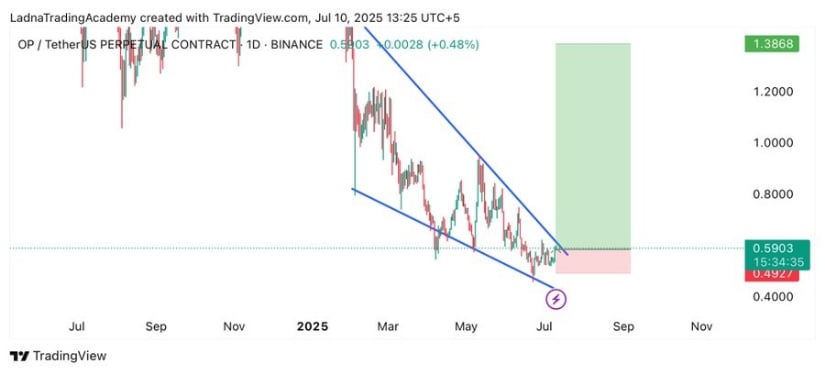
Analyst @LTSTrading (USA Signal) has also shared a falling wedge breakout setup that complements ZAYK’s outlook. The wedge pattern, compressing since February 2025, shows diminishing sell-side pressure.
Source: X
The breakout attempt above $0.59 suggests a trend reversal could be underway. This wedge formation carries an upside target of $1.38, referencing historical resistance and prior consolidation levels from early 2024. The invalidation level is placed below $0.49, giving traders a clear risk zone.
Price Surge Backed by Rising Volume and Market Reentry
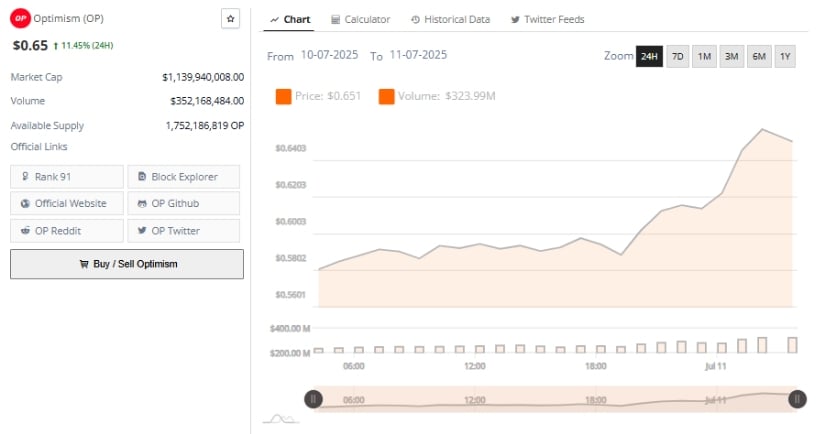
Data from BraveNewCoin’s 24-hour chart supports the recent surge, with OP gaining 11.45% from lows near $0.58 to a peak around $0.66. This price MOVE coincided with a notable spike in trading volume, which climbed above $352 million, a level not seen in recent sessions. The strongest volume inflows aligned with OP’s breakout from local resistance, reinforcing the legitimacy of the uptrend.
Source: BraveNewCoin
The asset’s market capitalization now stands at $1.13 billion, supported by a circulating supply of 1.75 billion OP tokens. The uptick in the volume-to-market-cap ratio indicates renewed interest in OP’s Layer-2 capabilities, potentially in response to increased ethereum scalability discussions. As long as bulls defend the $0.63–$0.65 area, short-term upside toward $0.70 remains possible.
Indicators Point to Expanding Momentum on Daily Technicals
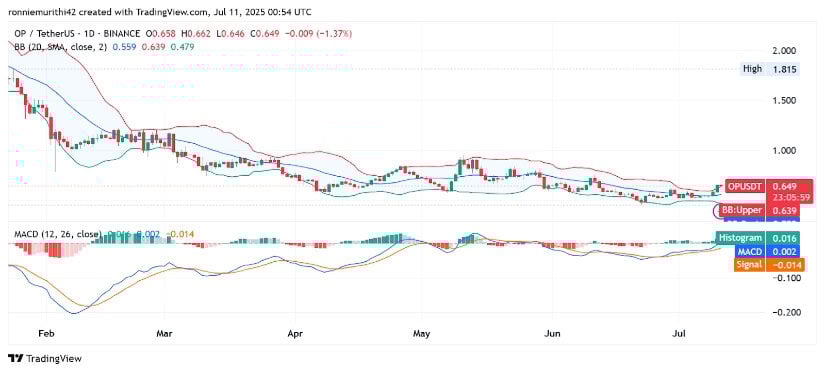
The TradingView daily chart reveals strong technical backing for the upward shift. OP has broken above the upper Bollinger Band, currently at $0.639, while candles continue to FORM above the 20-day simple moving average. This behavior indicates increasing volatility and growing buying interest. The Bollinger Bands are widening — a technical sign often associated with breakout confirmation.
Source: TradingView
Furthermore, the MACD (12,26) exhibits a positive crossover, as the MACD line surpasses the signal line and the histogram shifts to green at 0.016. This signal appears after a prolonged flat period, suggesting fresh bullish momentum is entering the market. As long as the price remains above the mid-band near $0.559 and volume continues building, OP may be positioned to retest $0.70 and approach mid-term targets near $1.20.
