Floki Primed for Explosion: Accumulation Phase Signals Imminent Price Surge

Memecoin's quiet grind could spark fireworks—traders stacking FLOKI like Wall Street hoards PDFs of 'The Intelligent Investor.'
The Setup:
Quiet accumulation often screams loud breakouts. Floki's chart echoes the eerie calm before DOGE's 2021 moonshot—minus Elon's tweet theatrics.
The Math:
On-chain data shows wallets with 10M+ FLOKI up 17% since June. Smart money's buying; weak hands got shaken out in May's 34% correction.
The Punchline:
Technical triggers align: • 21-week EMA acting as springboard • RSI coiled at 54 (neutral = runway for momentum) • Spot volumes creeping toward $200M daily
Just don't tell the 'fundamentals' crowd their beloved Shiba Inu rival runs on vibes and Viking memes. Sometimes markets reward those who embrace the absurd.

After a sharp breakout earlier this week, the token has managed to maintain higher ground, indicating possible accumulation by market participants. Price stability NEAR recent highs, combined with growing open interest and technical indicators, points to a potential continuation move. Traders are closely monitoring for confirmation signals as volume holds steady.
Breakout Momentum Stalls, But Bullish Bias Persists
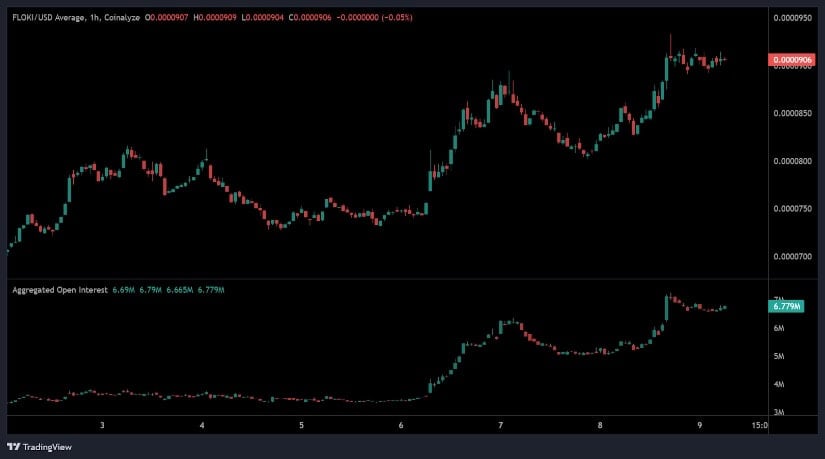
The 1-hour FLOKI/USD chart from Coinalyze highlights a decisive bullish MOVE that began on July 6, with prices rising from below $0.000075 to a high near $0.000095. This rapid appreciation followed a prolonged period of sideways trading, indicating a change in short-term sentiment. The rally was defined by large-bodied green candles, consistent with strong buying activity and a potential shift in market positioning.
Source: Chart by Open Interest
Following the breakout, FLOKI entered a tight consolidation range around the $0.000091 level. Price has since moved sideways with low volatility, signaling that the market may be forming a continuation pattern such as a bull flag. This behavior suggests that buyers are not rushing to exit positions, often an indication of sustained confidence.
Aggregated open interest data supports this view, with contracts rising from under 3 million to 6.77 million, reflecting significant Leveraged positioning by traders expecting continued upside.
The current consolidation phase near recent highs is being interpreted as a preparatory base for a potential next leg higher. However, elevated open interest levels also raise the risk of volatility if the price drops below support, triggering liquidations. For now, price action above $0.000090 and stable interest metrics suggest the short-term trend remains constructive.
Volume Expansion Accompanies Price Rise
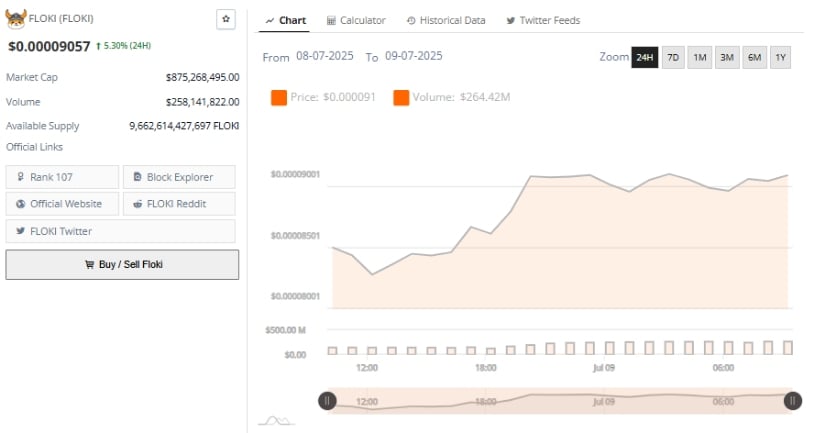
FLOKI posted a 5.30% gain over the past 24 hours, climbing to $0.00009057. The price action has followed a steady pattern of higher lows and highs throughout the session. A breakout that began midday on July 8 pushed the token above short-term resistance near $0.0000904, with continued buying carrying the price closer to recent highs by the session end.
Source: Chart by BraveNewCoin
Daily trading volume reached $264.42 million during this period, underlining strong participation and interest. Unlike thin-volume breakouts, FLOKI’s price rise appears to have been supported by substantial trade activity. Volume remained consistent overnight and into the morning of July 9, reinforcing the notion of an accumulation phase rather than a brief pump. If this buying momentum persists, FLOKI may attempt to reclaim the $0.000095 level in the coming sessions.
The token’s market capitalization currently stands at $875.2 million, placing it at position 107 among crypto assets. With a circulating supply exceeding 9.6 trillion tokens, FLOKI remains highly sensitive to volume surges. Sustained demand above the $0.000091 level may open the path to retesting prior local highs, while any dip in volume could trigger a short-term pullback toward $0.000089 or lower.
Technical Indicators Suggest Growing Bullish Momentum
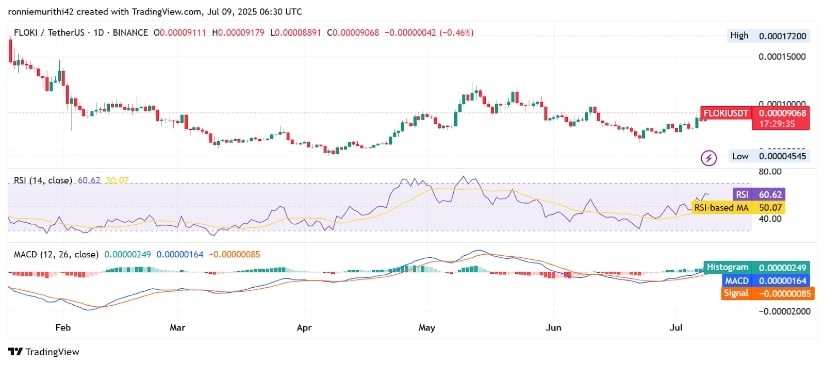
The daily FLOKI/USDT chart shows price trading at $0.00009068, with recent price action indicating higher lows since late June. The current candle is relatively neutral, but the broader structure reflects a gradual recovery from the June bottom near $0.000045. The token is now confronting a former support-turned-resistance level near $0.00009111, which could serve as a key trigger if breached on strong volume.
Source: Chart by TradingView
The Relative Strength Index (RSI) stands at 60.62, signaling mild bullish strength without reaching overbought conditions. Its position above the RSI-based moving average at 50.07 supports the view of growing momentum. If RSI continues to rise toward 70, it may confirm building demand pressure.
The MACD further supports this outlook. The blue MACD line has crossed above the orange signal line, and the histogram currently reads 0.00000249. This positive crossover points to a possible trend continuation, though confirmation WOULD require expanding histogram bars and price closing above $0.000095. Until then, FLOKI’s trend remains cautiously optimistic, supported by accumulation and rising indicators.

Log in to Reply
Log in to comment your thoughtsComments
Related Articles
|Square
Get the BTCC app to start your crypto journey
Get started today Scan to join our 100M+ users