Solana Primed for $219 Surge: Chart Patterns & Revenue Boom Signal Major Rally

Solana's charts are flashing green as technicals align with fundamental momentum—just as traders start paying attention again.
The setup: A textbook bullish pattern confirms alongside surging network revenue, putting SOL's $219 target squarely in play. No 'this time it's different' hopium—just cold, hard price action meeting adoption.
Why it matters: After months of sideways action, Solana's infrastructure upgrades and resurgent DeFi activity are finally reflecting in the metrics that move markets. Even the most cynical traders can't ignore the volume spikes.
Bottom line: When the charts and fundamentals agree, institutions listen. And right now, they're whispering 'buy'—while retail investors scramble to front-run the inevitable FOMO. Typical.

Solana looks like it’s gearing up for one of its biggest moves of the year. After topping all blockchains in Q2 revenue for the third quarter in a row, the charts are finally starting to catch up. The signs are getting clearer: strong fundamentals, steady demand, and now a price structure that’s hinting at a potential rally ahead.
Solana Tops All Chains in Q2 Revenue
Q2 numbers are in as shared by SolanaFloor, and Solana’s position at the top of the revenue chart is starting to look familiar. solana just closed out its third consecutive quarter as the leading blockchain by network revenue, pulling in over $271 million in Q2 2025. That puts it comfortably ahead of Tron, Ethereum, and even Bitcoin, based on the latest data from Blockworks.
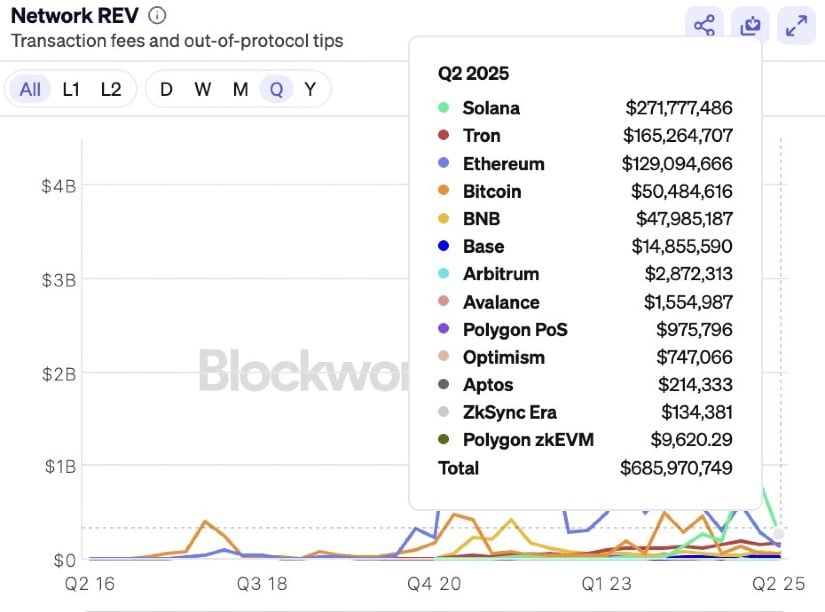
Solana leads all blockchains in Q2 revenue with over $271 million. Source: SolanaFloor via X
This kind of performance isn’t just about a single app or trend; it reflects growing consistency across the Solana ecosystem. When a network consistently generates this level of revenue, the price eventually starts to catch up. Strong fundamentals tend to draw sustained interest. As Solana keeps proving its ability to monetize real on-chain activity, the gap between utility and market value could start to narrow.
Solana Price Structure Forms Classic Reversal Pattern
With Solana leading on fundamentals, the price chart is beginning to reflect that same strength. As pointed out by Nebraskangooner, Solana price appears to be forming an inverse head and shoulders. The neckline sits just below $155, and price is currently hovering around $152. A clean breakout above that level could shift short-term momentum and target a potential move toward the $165 to $170 range, aligning with the 200-day moving average acting as dynamic resistance.
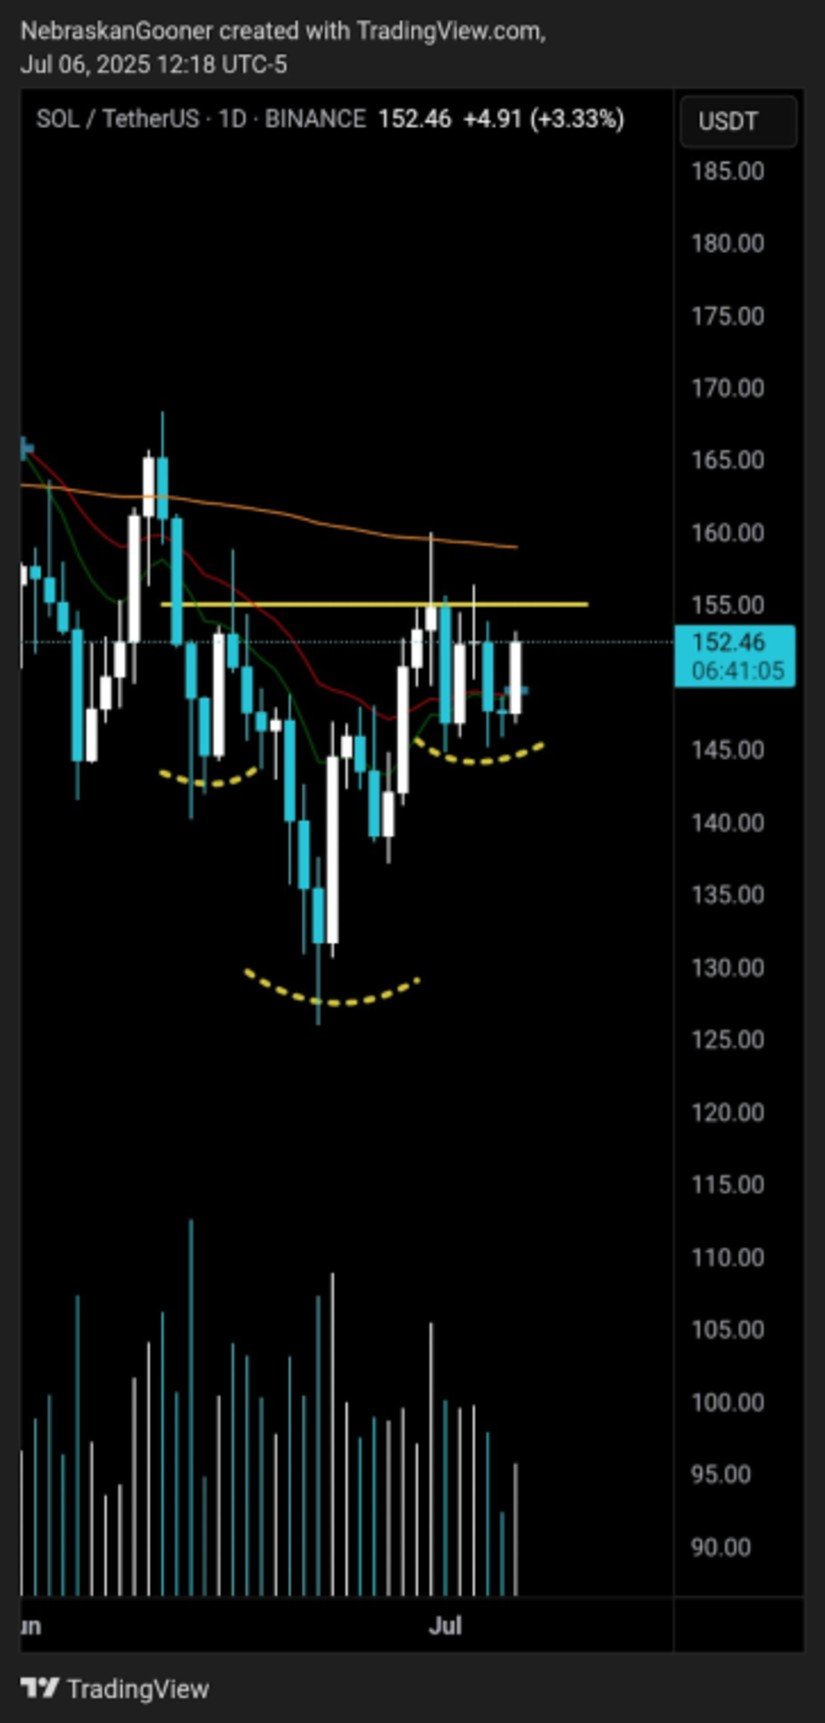
Solana price forms an inverse head and shoulders, eyeing a breakout above $155 with targets NEAR $170. Source: Nebraskangooner via X
The structure itself has been developing over the past few weeks, with higher lows forming the right shoulder and volume holding steady. In context with Solana’s recent Q2 revenue dominance, this technical setup adds weight to the idea that price may start catching up with on-chain momentum. If the neckline breaks with confirmation, it WOULD be a strong technical follow-through to what the fundamentals have already been signaling.
Solana Reclaims 4H Support
After forming a potential inverse head and shoulders on the higher timeframes, Solana just reclaimed a key 4H support-resistance zone, as noted by VeLLa Crypto. Price pushed back above the $150–$152 area and held, flipping what was previously a cap into a short-term base.
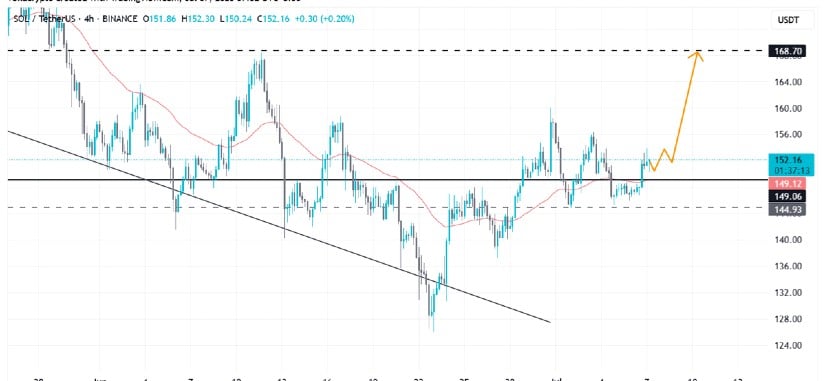
Solana reclaims the $150–$152 zone on the 4H chart, setting the stage for a potential push toward $166. Source: VeLLa crypto via X
This kind of S/R reclaim often acts as a trigger point if momentum follows through, and the chart is hinting at a possible run toward the $166 level if buyers stay active.
This reclaim could mark the transition from structure-building to trend acceleration. There’s still some overhead resistance to work through, but technically, the breakout above this local range puts Solana in a stronger position than it’s been in weeks.
Analysts Outline What Could Drive the Next Solana Move
With Solana reclaiming key levels across multiple timeframes, market watchers like 0xGumshoe are starting to map out what could fuel the next leg higher. Instead of hinging on a single catalyst, his view builds around a chain of developments, macro and micro, that could stack in Solana’s favor if momentum holds. The charts are improving, but so is the narrative behind them.
Here’s what’s on the radar:
- Bitcoin near ATHs could spark broader onchain interest and speculative flows.
- Onchain activity on Solana is already ticking up.
- Launch of the first Solana ETF opens the door to more inflows if price holds up.
- $160 remains the key breakout level.
- Strong buy pressure often follows when big names start moving, especially as capital rotates into trending L1s.
- Run towards $200 becomes more likely if Solana holds above $160 with volume.
The structure is now there, and with fundamentals backing it, the pieces are beginning to align.
Solana Price Prediction Eyes Breakout Zone With $200+ in Sight
Crypto analyst Alek_Carter points out that Solana is still stuck in a defined range, testing patience while consolidating just below resistance. The chart highlights $184 as the key level, until price closes above it, the MOVE remains on hold.
Structurally, Solana has been holding a series of higher lows since May, showing steady demand, but hasn’t yet pushed through the ceiling that could open up new upside.
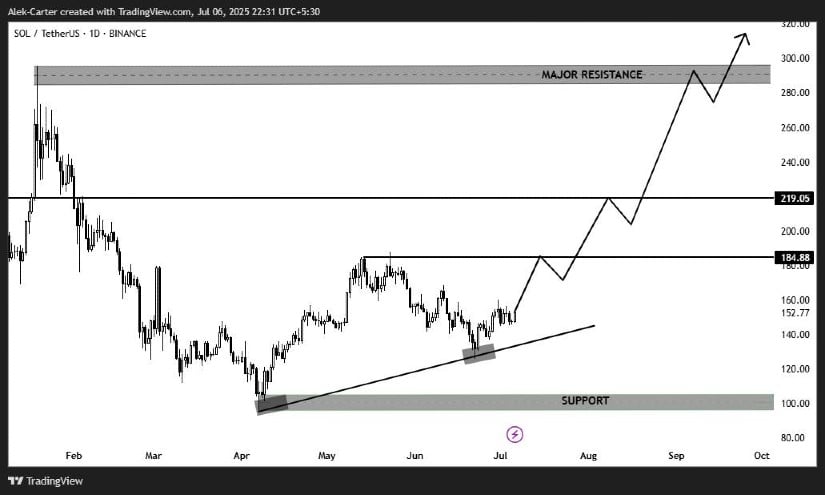
Solana consolidates below $184 resistance, with price eyeing $219 and $260–$300 as breakout targets. Source: Alek_Carter via X
If that breakout comes, the next major level on the radar is around $219, followed by the $260–$300 zone mapped as major resistance. Carter suggests that ETF inflows could provide the catalyst needed to flip this range, especially if momentum builds alongside broader risk-on sentiment.
Final Thoughts
Solana may still be stuck below major resistance, but the pieces are falling into place. From strong Q2 revenues to improving technicals and growing ETF speculation, the momentum is starting to lean bullish. Participants are not just throwing wild targets anymore; many are pointing to structured patterns and key levels like $160 and $184 that, if broken, could open the door to a run towards $200 and beyond.

Log in to Reply
Log in to comment your thoughtsComments
Related Articles
|Square
Get the BTCC app to start your crypto journey
Get started today Scan to join our 100M+ users