Floki Price Prediction: Key Support Holds Strong – $0.00001460 or $0.000036 Next?

Floki bulls dig in as critical support zone withstands selling pressure. Analysts now watch two explosive price targets—can the meme coin defy gravity again?
Key levels in play: The $0.00001460 marker looms as immediate resistance, while ambitious swing traders eye a moonshot toward $0.000036. Technicals suggest make-or-break momentum ahead.
Market psychology at work: Retail FOMO meets institutional skepticism (as usual). Will this be another 'buy the rumor, sell the news' cycle—or actual adoption? Only your portfolio knows for sure.

With momentum building gradually, analysts have identified critical thresholds that could determine whether FLOKI continues upward or re-enters a bearish channel. At the time of writing, FLOKI is trading at approximately $0.00007471.
Technical Setup Suggests Building Momentum Above Key Support
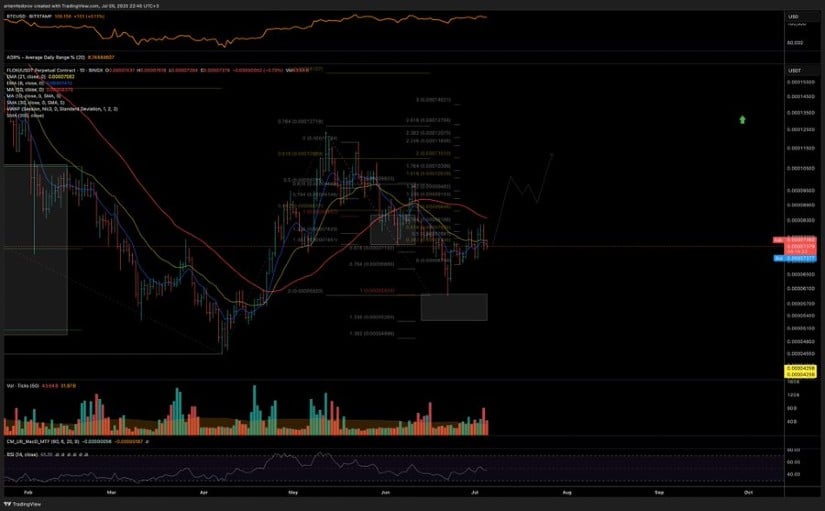
A recent post by analyst Artyom (@art_the_trader) outlines a bullish scenario developing on both the weekly and daily charts for FLOKI/USDT. The weekly structure remains intact, with the price holding above the June low and consolidating within a broader recovery formation.
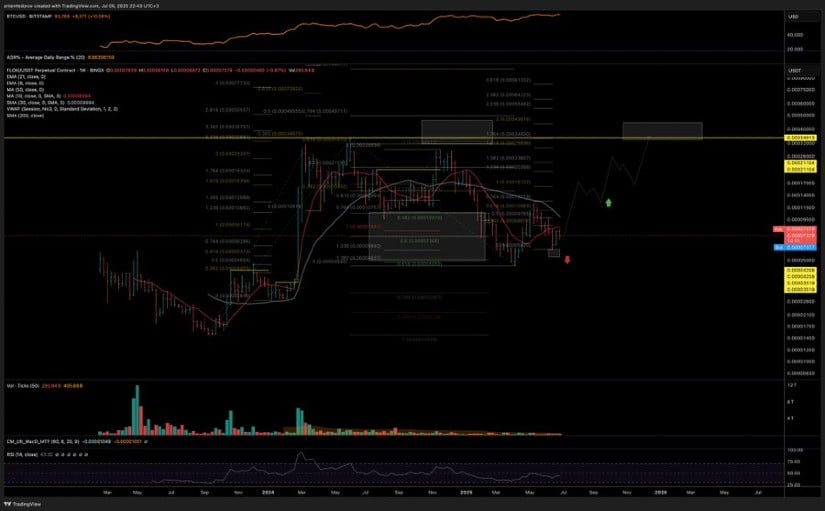
Source: X
Fibonacci retracement levels point to $0.00002554 and $0.00003652 as potential targets if current support continues to hold. The base NEAR $0.00000950, which historically attracted strong accumulation, reinforces the validity of the setup.
The daily timeframe supports this broader view, showing FLOKI maintaining its structure above July’s lows and trading above the 50-day moving average. A recent break of a descending trendline has opened room for short-term movement toward $0.00001160 and $0.00001460.
Source: X
The RSI has stabilized in the 45–50 range, while daily volumes have increased slightly during green candle formations. These signals indicate cautious Optimism among buyers, although a breakout above $0.00001040 is required to confirm further upside.
Price Volatility Persists Amid Declining Intraday Volume
The 24-hour chart shows price fluctuations within a narrow range. FLOKI touched a daily high of $0.00007650 before retracing to a low near $0.00007300, closing the session at $0.00007410. This represents a 4.27% intraday decline, reflecting ongoing pressure from sellers at local resistance levels. Despite these movements, support near $0.00007300 remains unbroken, suggesting the area continues to attract defensive buying interest.
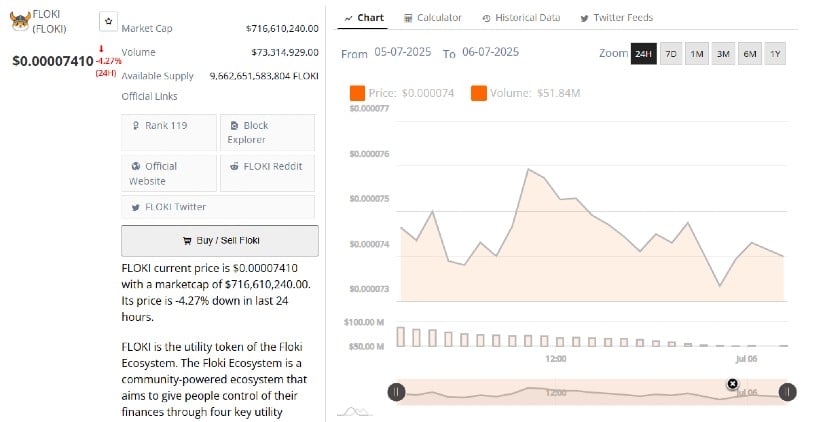
Source: BraveNewCoin
Volume activity offers additional insight into trader sentiment. The 24-hour trading volume stood at $51.84 million, down from $73.3 million the previous day. This reduction highlights waning activity, especially during recovery attempts, indicating that some market participants remain on the sidelines.
With FLOKI’s market capitalization at $716.6 million and a circulating supply of 9.66 trillion tokens, the token holds its rank at 119 across cryptocurrencies. However, to shift sentiment decisively, the market will need a spike in volume alongside a MOVE above immediate resistance zones.
Indicators Signal Early Reversal Signs Amid Sideways Structure
From a daily technical perspective, FLOKI is consolidating near short-term support after an extended downtrend. The RSI currently reads 47.74 and is trending slightly above its moving average, indicating a mild bullish divergence. Should the RSI rise above 50 and maintain that position, it WOULD strengthen the argument for a breakout toward $0.00010000 in the coming days.
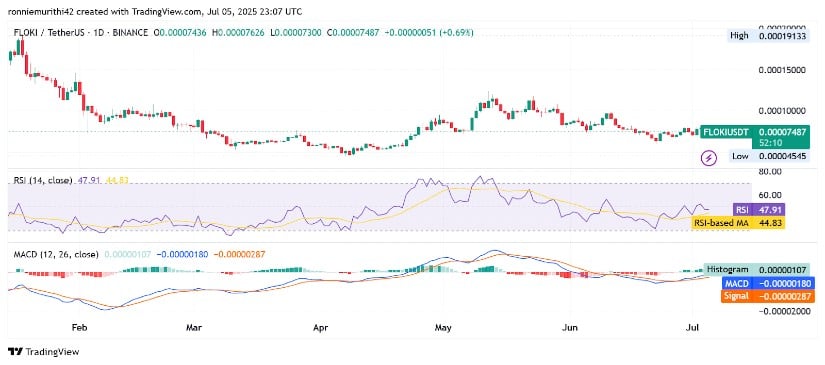
Source: TradingView
The MACD indicator also supports the possibility of a trend reversal. The MACD line at -0.00000181 is converging toward the signal line, with the histogram recently turning positive. These early crossover signals imply momentum may be shifting, but confirmation depends on stronger follow-through from buyers.
Without additional volume and a sustained breakout from the current consolidation band, FLOKI remains in a neutral-to-bullish state. The $0.00000750–$0.00000800 zone remains a critical support to watch in case of renewed downside pressure.
