BNB Rocket Alert: Technicals Signal $790 Breakout Before $983 All-Time High Assault

Binance Coin's chart is printing a textbook bullish pattern—and traders are loading up for the ride.
The setup: A clean breakout above key resistance could send BNB soaring past $790 within weeks. After that? Only the 2021 peak at $983 stands between the token and price discovery mode.
Why it matters: While traditional markets obsess over Fed minutes, crypto's algorithmic traders are busy front-running this technical formation. The playbook's simple—breakout, retest, then rip toward historical liquidity zones.
Reality check: Of course, this assumes Binance avoids another regulatory 'educational moment' with watchdogs. But for now, the charts don't lie—this trade's got legs.

At the time of writing, BNB is trading NEAR $658.80, positioning itself firmly in the middle of a rising channel pattern observed on longer time frames.
With stable volume flows and gradual price action, market participants appear to be cautiously preparing for a potential larger move. Technical indicators are beginning to show signs of early accumulation, setting the stage for possible expansion toward major resistance zones.
BNB Price Rising Channel Holds As Structure Tightens
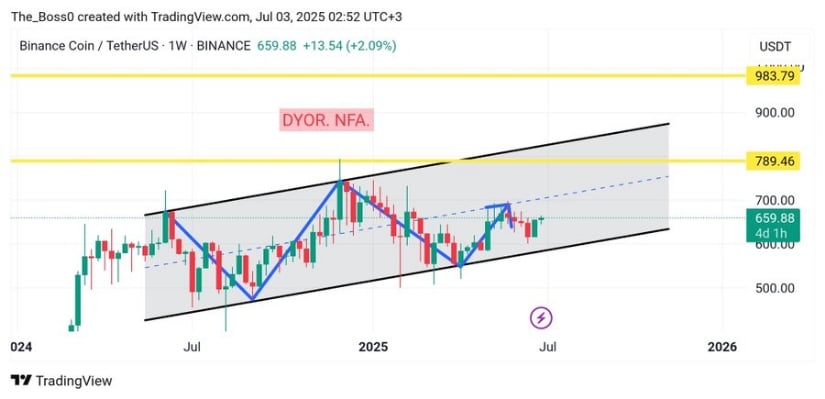
According to a weekly analysis by @Crypto_TheBoss, BNB has remained inside a well-defined parallel rising channel, with the current range between support at $570 and resistance near $790. The structure illustrates a consistent pattern of higher highs and higher lows, supporting a gradual bullish trend over time.
BNB price currently trades mid-channel, offering room for movement in either direction depending on broader market drivers. The analyst also identifies $789.46 as a horizontal resistance level, which aligns with the channel’s upper boundary.
Source: X
Further, the chart shows a recurring zigzag formation, where retracements are consistently met with buying pressure near the lower channel line. This pattern reinforces the idea of controlled corrections followed by rebounds, suggesting that buyers continue to defend downside moves.
The formation has served as a strategic guide for traders focusing on channel entries and exits, with the dashed trendline acting as a mid-range pivot for minor pullbacks or surges. Should the token break above the upper resistance, the next technical target lies at $983.79, a level marked as a long-term upside objective.
Binance Coin Price Prediction: 24-Hour Price Action Shows Accumulation Zone
In the short term, BNB is displaying limited volatility, trading within a narrow range of $656 to $664 during the last 24 hours. Data shows a closing price of $662.76, marking a modest 0.38% gain. Price fluctuations throughout the session formed several small peaks and valleys without breaking beyond the upper or lower bounds of the range.
This suggests accumulation behavior, possibly indicating preparation for a larger move. The $660 level is emerging as near-term support, evidenced by repeated rebounds from this zone.

Source: BraveNewCoin
The trading volume for the same period reached $721.78 million, but without any major volume surges. Instead, volume remained evenly distributed, indicating a balanced market with no dominant buyer or seller pressure. Market capitalization now stands at $96.68 billion, and BNB maintains a ranking number 5 globally.
This stability, combined with strong liquidity and large-cap status, keeps BNB in focus as one of the more consistent digital assets, particularly as Bitcoin’s price action remains range-bound.
Indicators Signal Early Momentum Shift
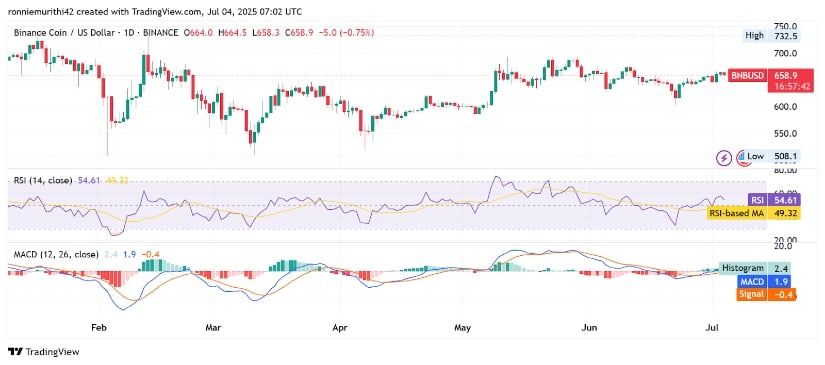
On the other hand, the daily chart for BNB price reflects ongoing consolidation within the broader $600–$680 range. The most recent candles show limited directional momentum, but several indicators suggest the possibility of a near-term shift.
The Relative Strength Index (RSI) is currently at 54.55, slightly above the neutral 50 mark, and has crossed over its moving average of 49.32. This signals mild bullish momentum, although stronger confirmation WOULD require a push above RSI 60.
Source: TradingView
Additional momentum insight comes from the MACD (12,26), where the MACD line sits at 1.9, ahead of the signal line at -0.4, with a histogram value of 2.4. This configuration marks the start of a bullish crossover, which, although modest, points to growing upward pressure.
The price at the time of writing is $658.80, and unless rejected near the $680 resistance, BNB price could MOVE toward a breakout. Sustaining this momentum with rising volume may open the path toward testing the $790 channel resistance, and potentially extend toward the $983 zone if macro sentiment aligns.
