Chainlink (LINK) Smashes 200 EMA Barrier: $18 Target Now in Play

Chainlink just bulldozed through a critical technical level—and traders are scrambling for position.
The 200-day exponential moving average (EMA) crumpled like a paper target, clearing the path for what could be a 30% sprint to $18. No "maybe" hedging here—LINK's price action is shouting its intentions.
Why this matters: Breaking the 200 EMA isn't just chart candy. It's the equivalent of a stock punching through its 200-day moving average—a signal that flips algo traders from skeptics to believers overnight.
Watch the volume: Thin liquidity could turn this breakout into a fakeout. But with derivatives open interest climbing and spot markets playing catch-up, LINK might just give Bitcoin a run for its money (literally—those BTC maximalists hate that).
Bottom line: When an oracle token starts moving like a meme coin, either the market's gone insane or institutions are quietly building positions. Either way—buckle up.

A breakout above its multi-week descending channel has shifted short-term momentum to the upside, supported by technical indicators and chart structures.
With LINK now trading above a key exponential moving average, analysts are beginning to eye higher resistance levels. Attention is now focused on whether bullish pressure can sustain beyond the $14.00 resistance.
Channel Breakout Signals: Technical Shift
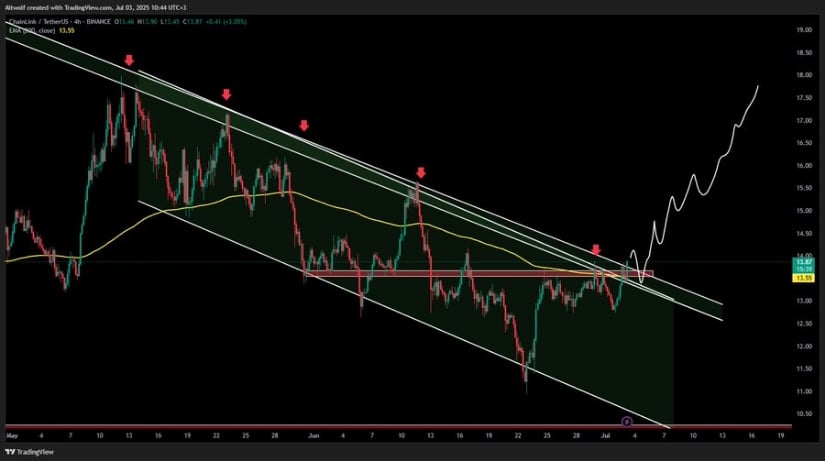
The 4-hour chart of LINK/USDT, as shared by analyst AltWolf, highlights a decisive breakout from a descending channel that had contained the token since early May. This breakout occurred just above the $13.50 level, marking a shift from lower highs toward a structure more favorable to buyers.
Notably, the breakout was accompanied by a price MOVE above the 200 EMA, a widely followed trend indicator. The reclaim of this level reinforces the breakout’s validity and may indicate a medium-term reversal.
Source: X
AltWolf identifies a key support zone between $13.30 and $13.60, previously acting as resistance. The recent price action shows a potential retest of this zone, which may confirm support before any further upward continuation.
If the retest holds, the projected path points toward $15.50 in the NEAR term and potentially $18.00 as a longer-term target. This projection aligns with historical resistance observed in April and fits the technical profile of a measured move following a channel breakout. Volume will be a critical component in confirming this breakout trajectory.
Price Volatility and Participation Suggest Temporary Resistance
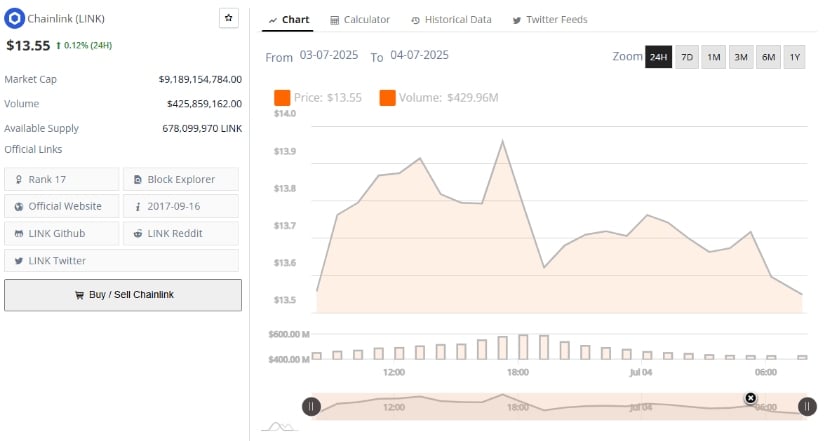
The 24-hour performance of chainlink price from July 3 to July 4, 2025, recorded moderate price swings. LINK opened near $13.55 and climbed to an intraday peak of $13.93, before closing around $13.67, marking a 0.73% gain.
While the session began with strong upward momentum, resistance near $14.00 led to a pullback, reflecting possible profit-taking. This suggests that while bullish sentiment is building, there remains hesitation near psychological levels.
Source: Brave New Coin
Trading volume peaked around midday in conjunction with the price rally, confirming that the surge had market support. However, both price and volume declined in the later part of the session, indicating reduced follow-through. This divergence underscores the importance of renewed buying activity to sustain any upward movement.
LINK’s market cap stood at $9.27 billion, supported by a circulating supply of 678 million tokens. Until a clean break above $14.00 occurs with increased participation, the price may remain range-bound between support at $13.30 and resistance at $14.20.
Momentum Indicators Suggest Cautious Optimism at the Time of Writing
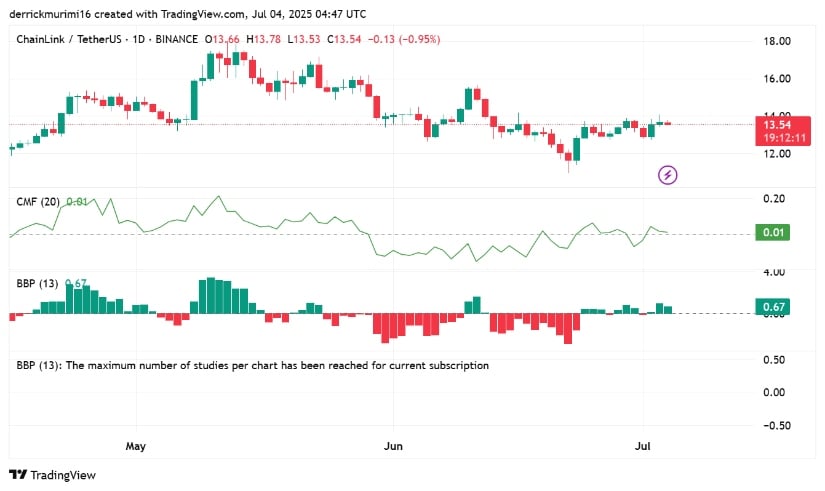
As of July 4, 2025, LINK is trading at $13.54, down 0.95% on the day. Recent price action has been confined within a relatively narrow band, forming a base near $13.00 after a broader correction from April highs above $17.00. The overall trend on the daily chart remains neutral, with alternating candles of minor gains and losses reflecting market indecision.
Source: TradingView
Momentum indicators present mixed signals. The Chaikin Money Flow (CMF) sits at 0.01, indicating mild capital inflow, though not enough to suggest strong accumulation. A sustained move above +0.05 WOULD be required to confirm growing buyer conviction.
Meanwhile, the Bollinger Band Percent (BBP) stands at 0.67, placing the current price near the upper range of recent trading activity. If LINK maintains its position above $13.50 and closes higher with growing volume, a breakout toward $14.50 or beyond remains possible. Failure to hold this level could see LINK retest support closer to $12.80 in the near term.
