Hedera (HBAR) Breaks Out: 20% Price Surge Imminent as Bulls Take Control

Hedera's native token HBAR just triggered a technical breakout that could send prices soaring. Here's why traders are flipping bullish.
The breakout playbook
HBAR smashed through a critical resistance level with conviction—the kind of move that makes chartists reach for their Fibonacci extensions. The 20% upside target now in play mirrors previous momentum surges in the altcoin's history.
Institutional whispers growing louder
While retail traders chase memecoins, smart money's been quietly accumulating HBAR positions. The enterprise-focused blockchain keeps landing real-world use cases while other projects peddle vaporware and half-baked roadmaps.
The cynical take
Of course, in crypto-land, a 20% move barely qualifies as a rounding error after your morning coffee. But for a project actually building something? We'll take it—just don't tell the degens over in shitcoin alley.

Analysts are now observing structural breakouts on multiple charts that support the potential for a continued rally. With investor sentiment gradually shifting, HBAR is now being closely monitored for possible upside toward the $0.18 to $0.20 price zone.
Breakout Structure Highlights Reversal Pattern
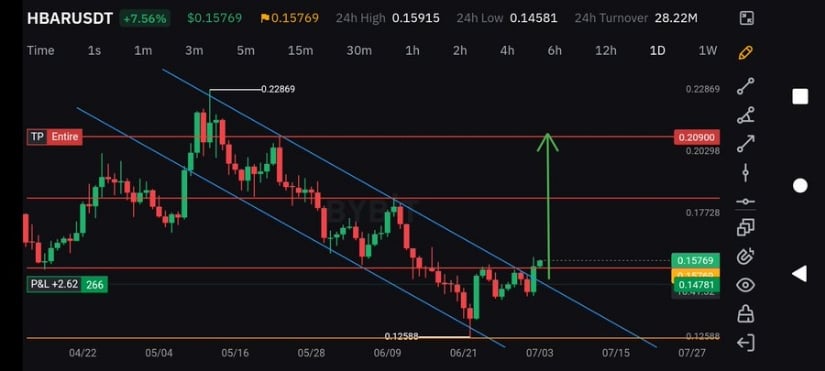
In the shared daily chart of HBAR/USDT, a clear breakout from a descending channel is evident. This channel had contained price action since early May, but the recent bullish candle pushed the price above the upper boundary NEAR $0.15, confirming a reversal setup.
The price reached $0.15769 at the time of the analysis, representing a 7.56 percent intraday gain. This type of breakout is typically associated with the end of bearish pressure and the beginning of a potential trend reversal.
Source: X
Key resistance levels have been established at $0.17728 and $0.20900, which are also reflected in technical projections marked as Target 1 ($0.18) and Target 2 ($0.203). The formation of a higher low before the breakout further confirms growing buyer strength.
Horizontal support has formed around $0.14781, just above a previous bottom at $0.12588, offering a reference level for traders managing risk. These technical signals point to a favorable short-term outlook if momentum is sustained.
According to technical analyst Narendra Pratap Singh (@npsingh793), this breakout setup presents a viable entry zone. He notes that the market structure, combined with improving volume, supports further movement toward the identified targets.
Singh cautions that confirmation over the next few sessions is essential to validate the breakout. A sustained move above $0.157 and growing trading activity WOULD improve the probability of reaching the $0.18–$0.203 range.
Market Data and Analyst Outlook Strengthen Bullish Case
Data from Brave New Coin supports the technical perspective, showing HBAR trading at $0.16 with an 8.09 percent 24-hour increase. The token now has a market capitalization of $6.61 billion and ranks 27th globally. Trading volume reached $192.84 million within the same period, indicating elevated market engagement and buyer activity. With over 42.39 billion tokens in circulation, HBAR continues to offer DEEP liquidity across exchanges.
Source: X
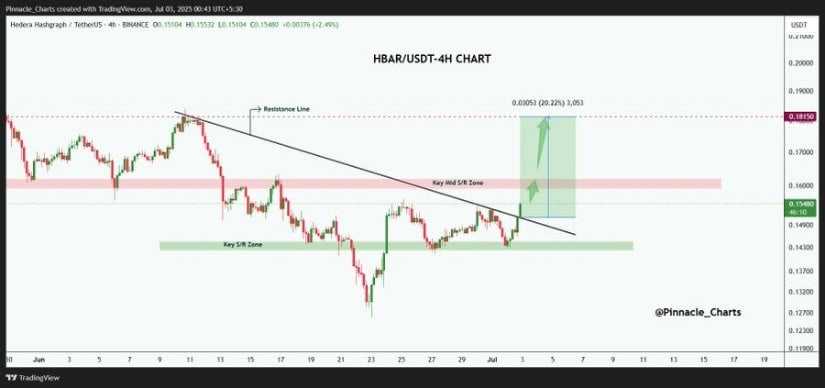
In a recent update on X, analyst @Pinnacle_charts highlighted a breakout on the 4-hour HBAR/USDT chart. He stated, “$HBAR/USDT just broke out of a clean downtrend line on the 4H chart! It’s bouncing off a key support zone and now flipping a mid S/R level with 20% upside potential toward the $0.1815 zone.”
This projection closely aligns with current technical targets and reinforces the possibility of a bullish continuation if momentum remains strong.
Indicators Show Strengthening Momentum
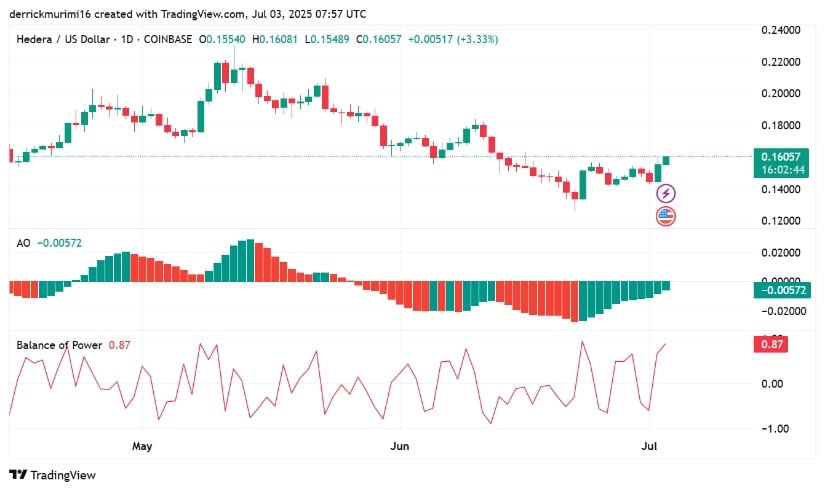
The daily chart of HBAR/USD reflects a price of $0.16060, marking a 3.35 percent gain. The token has rebounded from a recent low near $0.125 and formed a pattern resembling a double bottom. HBAR price has since broken above the $0.155 resistance level, confirming a short-term trend reversal.
This breakout is consistent with the earlier descending channel structure observed on the Bybit chart, suggesting convergence in technical signals across platforms.
Source: TradingView
Momentum indicators also support this view. The Awesome Oscillator (AO), which measures short-term market strength, has started displaying green bars after a prolonged bearish period. While still below the zero line at -0.00572, the upward trend of the histogram signals fading bearish pressure.
A crossover into positive territory would further validate the bullish outlook and increase the likelihood of HBAR challenging resistance at $0.18 and $0.20.
The Balance of Power (BOP) indicator stands at 0.88, representing strong buyer dominance. Readings near +1 typically reflect high levels of accumulation, often associated with institutional interest or large trading volumes.
This aligns with the breakout and the broader increase in market activity. A daily close above $0.165 would confirm price strength and set the stage for further upward movement in the short to medium term.
