Optimism Price Primed for Explosion—Key Resistance Break on Heavy Volume Could Trigger Rally

Layer 2’s dark horse flexes bullish momentum.
### The Setup: A Textbook Breakout Candidate
Optimism (OP) coils beneath a critical resistance level—the kind that either crushes dreams or fuels 50%+ rallies. Trading volume’s the tell: if buyers swarm in, this could be the launchpad.
### Why Traders Are Eyeing the Charts
No fancy indicators needed. Price action’s screaming ‘pounce or regret’—classic Wyckoff accumulation vibes. And let’s be real: after the last crypto winter, even Wall Street’s pet ‘analysts’ are quietly reloading altcoin bags.
### The Cynic’s Corner
Sure, ‘this time it’s different’—until the next ‘black swan’ Twitter thread tanks the market. But hey, at least the SEC hasn’t called it a security… yet.

OP price action on the hourly and daily charts shows early signs of recovery from recent lows, with critical resistance levels now in focus. Analysts and algorithmic models are pointing to key price zones where the market could shift decisively in either direction.
Open Interest and Price Structure Reflect Cautious Recovery
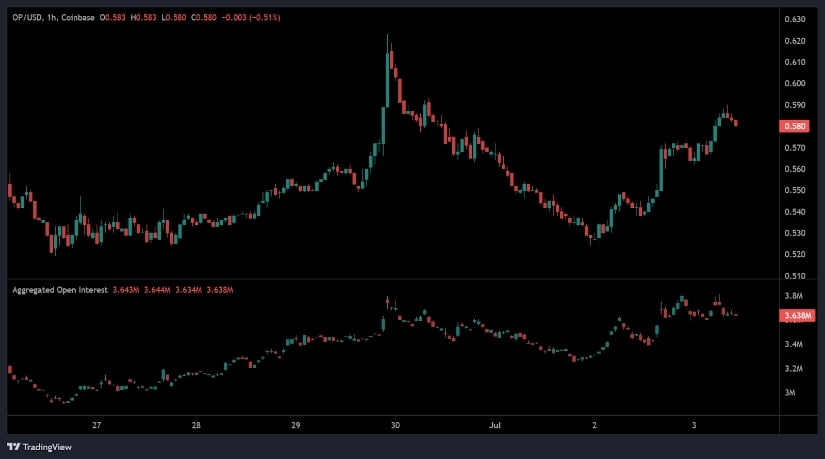
On the 1-hour price chart, Optimism (OP/USDT) experienced heightened volatility over the observed period. After forming a consolidation base between $0.52 and $0.54, the price surged toward $0.63 before a rapid pullback brought it below $0.55.
A recovery followed, with OP gradually climbing to the $0.58–$0.59 range before showing signs of a minor retracement. This behavior indicates an active but uncertain market environment where buyers and sellers are still seeking direction.
Source: Open Interest
The aggregated Open Interest (OI) data reveals parallel shifts alongside the price movement. OI rose in tandem with the initial price breakout, peaking around the same time as OP reached $0.63. Following the decline, OI also retreated, signaling the closure of Leveraged positions.
In the latest upward attempt, OI stabilized around 3.64 million, reflecting renewed engagement from traders but with limited aggressive positioning. This balance suggests that market participants are cautiously optimistic, awaiting clearer signals before committing larger capital.
Optimism Price Prediction: AI Model Highlights Key Support and Invalidation Zones
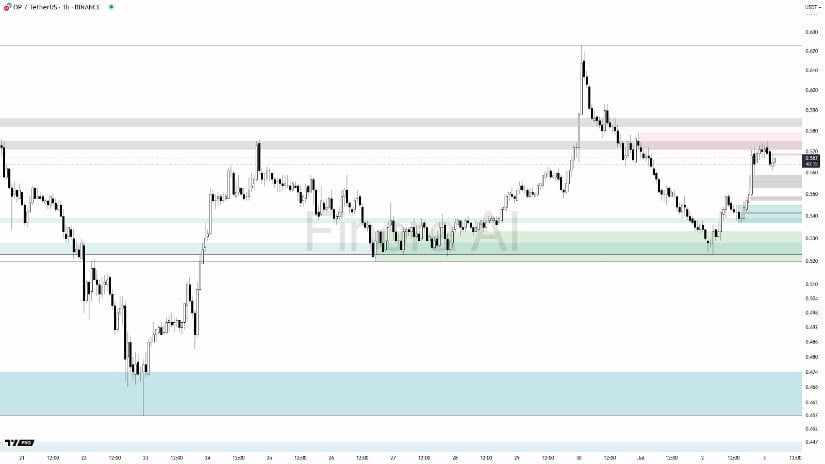
According to a recent X post by Finora AI – Deutschland, the algorithmic forecast for OP/USDT outlines a structured bullish outlook with important caveats. The model anticipates a short-term correction that may bring OP into the $0.554–$0.551 support area, identified as a potential accumulation zone for long positions.
However, Finora AI underscores the necessity of waiting for validated reversal patterns—such as a Bullish Engulfing candle, Pin Bar, or recovery after a liquidity sweep—before initiating trades.
Source: X
The AI’s technical invalidation level is a 1-hour close below $0.551, which WOULD nullify the bullish case and indicate potential for further downside. Conversely, a strong hourly close above $0.564 would bolster confidence in the bullish scenario, possibly triggering a move toward higher resistance levels.
Traders are advised to focus on confirmed closing prices and avoid reacting to transient intraday fluctuations. This approach emphasizes patience and structure, aligning with the current technical landscape.
Source: Brave New Coin
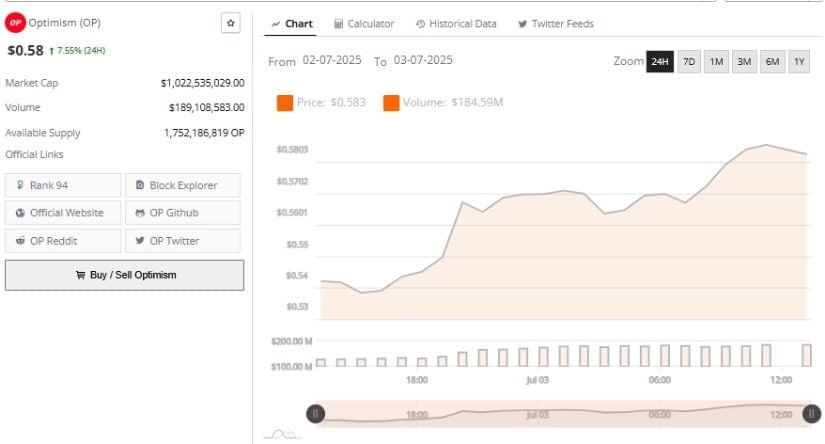
Data from Brave New Coin at the time of writing reports OP trading at $0.58, with a market capitalization of $1.02 billion and 24-hour volume reaching $189 million. The circulating supply stands at over 1.75 billion tokens, providing ample liquidity for both short-term speculation and long-term positioning.
The price now sits above the proposed pullback zone, suggesting an early breakout attempt. A sustained MOVE above $0.564 could validate this outlook and shift sentiment more firmly in favor of buyers.
Technical Indicators on Daily Chart Suggest Emerging Momentum
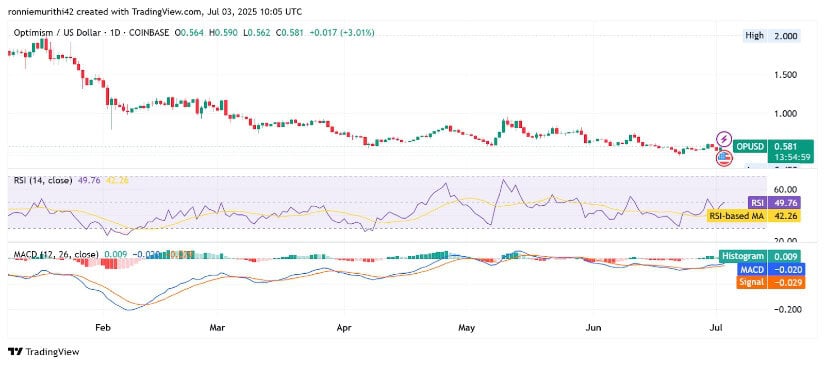
On the daily chart, OP/USDT is attempting to recover from a broader downtrend that saw price drop from $2.00 to a low NEAR $0.56. Currently trading at approximately $0.578, the chart reflects a gradual emergence of buyer interest near a critical support level. The recent formation of green candles indicates a potential bottoming structure, though a breakout above previous swing highs remains necessary to confirm trend reversal.
Source: TradingView
The Relative Strength Index (RSI) is currently at 49.36, just below the neutral 50 threshold. It has crossed above its RSI-based moving average of 42.23, indicating an early shift in momentum. A clear move above 50 could pave the way for further price appreciation toward resistance zones around $0.65 and $0.72.
The MACD histogram has turned slightly positive at 0.009, while the MACD line approaches a bullish crossover above the signal line. These early signals suggest improving sentiment, but confirmation through price action and increased volume remains essential for further gains.
