Chainlink Eyes Bullish Reversal: Can $12.60 Support Spark the Next Rally?

Chainlink teeters at a make-or-break moment—will $12.60 hold as the springboard for its next leg up?
After weeks of sideways action, LINK bulls are betting on a classic support bounce. The oracle network’s token has flirted with this level before, but this time, the stakes feel higher.
Market watchers note thin order books below $12—if that floor cracks, things could get messy fast. Then again, when has crypto ever done the predictable thing? (Cue eye-roll at ‘institutional adoption’ narratives.)
Either way, one thing’s certain: traders aren’t waiting around for fundamentals to matter again. The charts are calling the shots now.

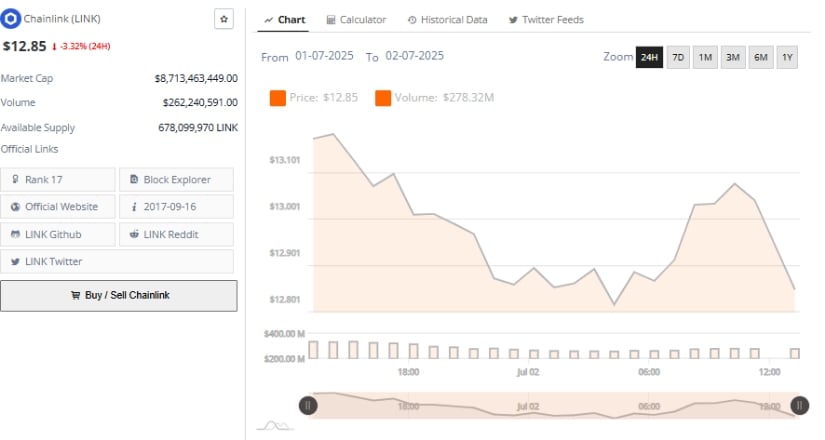
Chainlink (LINK) Price Prediction is currently trading at $12.85, reflecting a 3.32% drop over the past 24 hours, based on data from Brave New Coin. The token maintains a market capitalization of $8.71 billion, placing it at #17 among global cryptocurrencies.
The price movement follows broader weakness across altcoins as Bitcoin’s consolidation below $110,000 continues to shape sentiment across the crypto market.
Chainlink Price Range Holds Key Support
Data from Brave New Coin covering the 24 hours from July 1 to July 2, 2025, shows Chainlink price prediction fluctuating within a range of $12.60 to $13.10. The asset remains under pressure following rejection near the $13.50 resistance zone in recent sessions.
Source: Brave New Coin
This resistance level has proven difficult to breach, and LINK price continues to trade below it without significant volume confirmation. The $12.60–$12.70 region has emerged as a critical near-term support, where previous consolidations in late June helped stabilize price action.
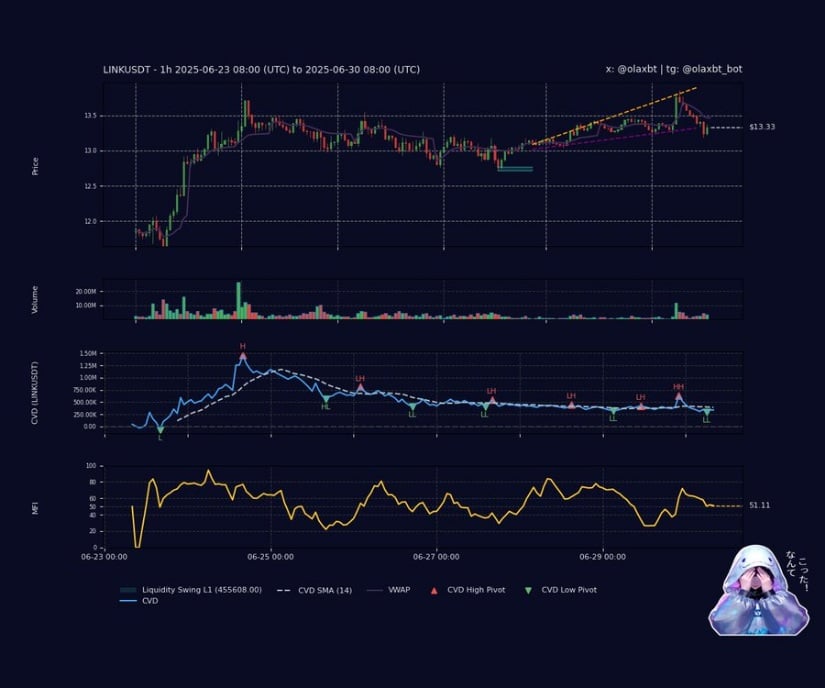
Technical signals suggest the market is building toward a directional shift. A MOVE below the current support could trigger a decline toward $12.00, while a successful rebound may guide LINK back toward $13.30–$13.50. On X, analyst AltwolfCrypto reported a MACD bullish crossover on the 1-hour LINK/USDT chart, suggesting a potential shift in short-term momentum.
Source:X
This indicator may point to early accumulation if prices remain stable above $12.60. The presence of technical compression paired with indicator crossovers may position LINK for a decisive move once a key price level is broken.
EMA Resistance and Market Correlation Highlight Risk
Crypto analyst AltWolf (@AltwolfCrypto) highlighted LINK’s proximity to the 4-hour 200 EMA, a level that often acts as dynamic resistance for many altcoins. According to AltWolf, multiple altcoins—including LINK—are currently reacting to this EMA, with price activity being closely tied to Bitcoin’s trajectory.
The analyst noted that short positions remain profitable across altcoins, but suggested that a breakout could occur should Bitcoin approach or break through the $110,000 level. This suggests that LINK’s short-term direction may remain influenced by macro market developments.
Source: X
In addition to the EMA reference, another analyst emphasized the importance of managing risk around current ranges. With LINK holding close to a major moving average and exhibiting consolidation, the next few sessions may determine whether the asset continues to decline or resumes upward movement.
The observed conditions align with Brave New Coin’s range-bound analysis, underscoring the fragile state of altcoin momentum in current market conditions. As bitcoin consolidates, traders remain alert to correlated movements that could impact LINK’s setup.
Chainlink Price Prediction: Indicators Reflect Mixed Momentum
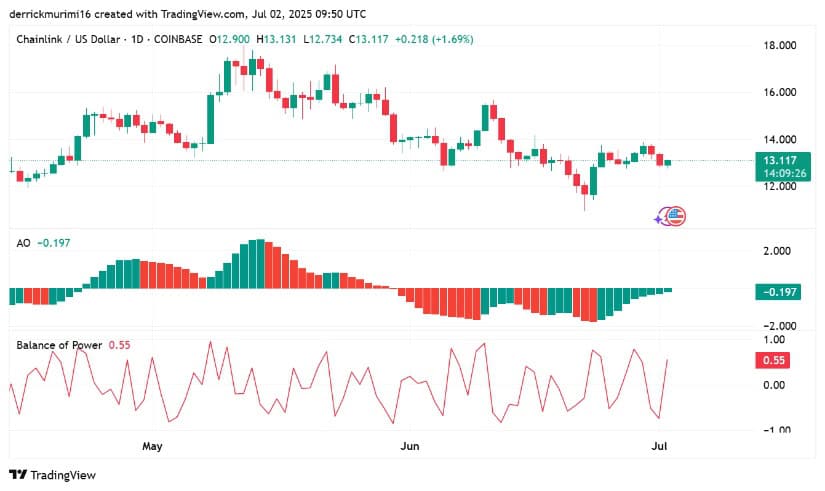
Technical indicators from TradingView offer a mixed outlook on Chainlink’s daily price chart. The Awesome Oscillator (AO) remains in negative territory at -0.197, although a gradual shift toward the zero line signals easing bearish momentum.
A transition into positive territory on the AO WOULD be necessary to validate stronger upward movement. Meanwhile, the Balance of Power (BoP) indicator has moved into positive territory, currently printing +0.55, reflecting improved buying pressure in recent sessions. However, inconsistent BoP readings throughout June suggest that this control remains tentative.
Source: TradingView
The Relative Strength Index (RSI), currently at 39.29, remains below its neutral threshold, signaling that LINK is still trading in a bearish zone. The lack of higher highs on RSI and low buying volume indicates that confidence among buyers is limited.
For LINK to break above the key $14–$14.50 resistance zone, momentum indicators would need to strengthen meaningfully. Until then, the asset remains in a holding pattern, with traders watching for either renewed volume or external market cues to shift sentiment.
