Sei Price Eyes $0.3046 Reversal: Traders Brace for Breakout
Sei's chart flashes bullish signals as traders pile into reversal bets. The $0.3046 target looms—will it trigger a cascade of FOMO buys or another 'rug pull' disguised as a breakout?
Technical setup: The 4-hour chart shows a potential double bottom forming near support. Volume spikes suggest accumulation, but remember: in crypto, 'accumulation' often means 'whales preparing to dump.'
Market sentiment: Retail traders are chasing the pattern while institutional players watch from the sidelines—classic crypto theater. If Sei holds above $0.28, the rally could gain steam. Fail, and it's another entry for 'Crypto Rekt' compilations.
Final thought: Every altcoin breakout deserves skepticism until proven otherwise. After all, what's a 30% pump when the market maker's spreadsheet says 'sell at 31%'?

Sei Network (SEI) is navigating a critical zone as market participants assess whether the recent correction will transition into a bullish recovery.
Despite the short-term dip, a combination of technical signals and analyst commentary suggests that the asset may be approaching a pivotal support range. With a market cap of $1.54 billion and over 5.5 billion tokens in circulation, SEI remains a closely watched asset for both short- and long-term participants.
Price Movement and Volume Context
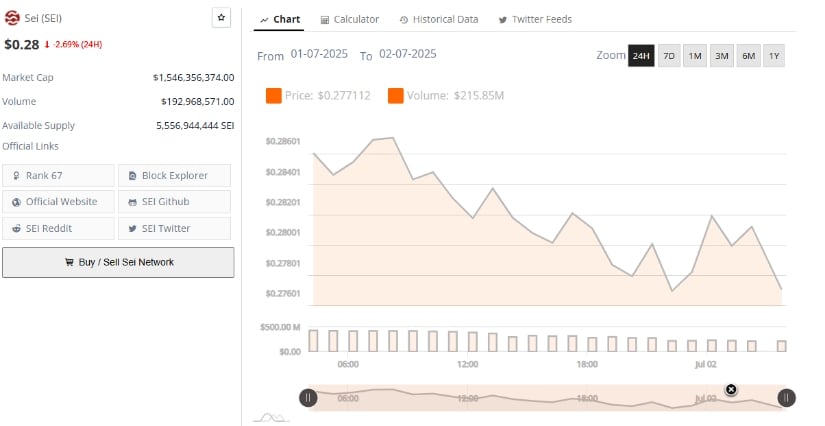
The latest 24-hour chart data from Brave New Coin shows Sei trading in a narrow range between $0.28 and $0.2739, reflecting consistent but controlled selling activity. This movement follows a moderate rally at the end of June, where the price tested the $0.30 resistance level before pulling back.
There are no major volume spikes accompanying the decline, suggesting this is part of a typical correction cycle rather than a reaction to external shocks. The 24-hour trading volume stands at $192.97 million, reinforcing steady market engagement despite the slight downtrend.

Source: Brave New Coin
Market behavior during this period suggests that traders are positioning cautiously, monitoring for signs of a bottom before initiating new entries. The price has hovered above the $0.26–$0.27 support range, which served as resistance in previous weeks.
This historical level may now act as a key pivot for either continued consolidation or a MOVE toward higher resistance levels if momentum shifts.
Analyst Insight Highlights Liquidity and Reversal Scenarios
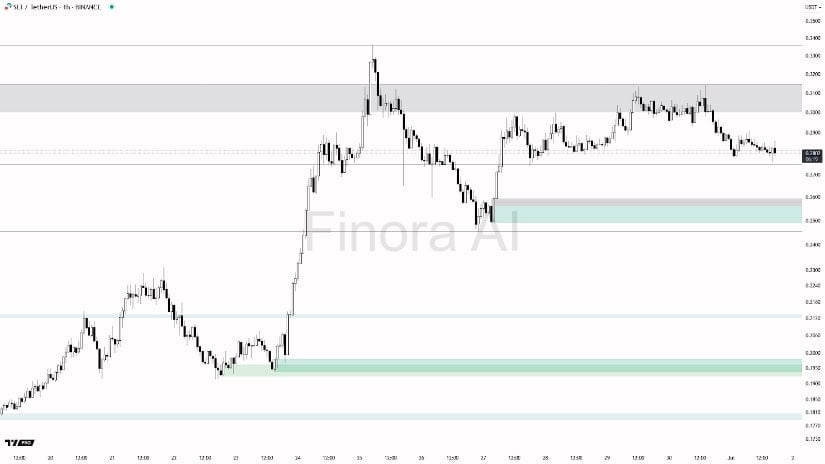
According to an update shared by Finora AI (@FinoraAI_PT) on X, SEI/USDT’s short-term outlook remains predominantly bearish. The automated analysis expects the price to decline further into the $0.2727–$0.2684 range.
This area is identified as a potential liquidity zone where a swift downward move, followed by immediate recovery, could indicate the formation of a long setup. The AI model outlines targets at $0.2808, $0.2944, and $0.3046 for a bullish rebound, contingent on volume support and confirmation through reversal candlestick patterns.

Source: X
In the alternative scenario, if SEI approaches the upper resistance range between $0.2944 and $0.3046 but fails to break through—especially with visible rejection—there may be a case for entering short positions.
This setup WOULD bring downside targets back toward the $0.2808 and $0.2684 zones. The analysis provides a clear technical roadmap with conditions for both bullish and bearish outcomes, offering strategic reference points aligned with Brave New Coin’s observed price behavior.
Technical Indicators Show Mixed Momentum
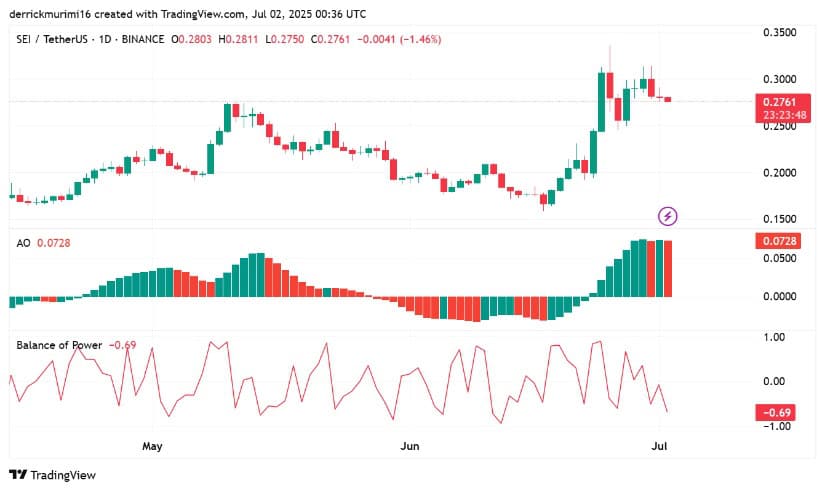
The SEI/USDT daily chart, as of July 2, 2025, reflects a slight decline with the token trading at $0.2739, down 2.25% for the session. The current structure suggests that momentum has stalled below $0.30, with upper wicks on recent candles indicating persistent sell pressure.
Although the price continues to find support around the $0.26–$0.27 area, bullish follow-through has yet to materialize, creating a neutral zone where sentiment could shift quickly.

Source: TradingView
Supporting this view, the Awesome Oscillator (AO) remains in positive territory at 0.0727, though weakening as recent bars show diminishing strength. The Balance of Power (BoP) indicator is notably bearish at -0.84, highlighting that selling interest has outweighed buying over recent sessions.
If SEI fails to regain traction above $0.30 with confirmation from stronger volume, the current consolidation may give way to another downward leg. However, if momentum returns at support, a recovery toward the outlined targets remains possible.

