Shiba Inu (SHIB) Primed for Explosion: Technical Breakout Signals Rally Beyond $0.000025

The meme coin that refuses to die just got a second wind.
Shiba Inu’s chart is flashing textbook breakout signals—the kind that make crypto degens foam at the mouth. We’re talking ascending triangles, volume spikes, and a stubborn refusal to acknowledge bear market logic.
The Setup:
SHIB’s coiled tighter than a Wall Street exec’s conscience. Every retest of support has bounced harder than a crypto influencer’s credibility.
The Target:
Clear skies until $0.000025—where the 2021 bagholders are waiting to dump on retail (again). After that? Either a moonshot or a rug-pull, depending on which Twitter guru you ask.
Pro tip: Watch Bitcoin’s movements. Because in crypto-land, even the ‘decentralized’ projects still orbit BTC like desperate moons.

Technical indicators, along with chart patterns, suggest that shiba inu may be on the verge of a strong upward movement, despite ongoing selling pressures from large holders.
Bullish Technical Setup Signals Imminent Breakout
The shiba inu price has recently formed key bullish structures on both weekly and daily charts. One of the most notable is the descending wedge pattern, a formation often regarded as a precursor to a strong rally. The price has been trading inside this wedge for months and appears to be nearing a breakout point.

Shiba Inu is currently priced at $0.00001137 and shows potential to surpass the $0.000025-$0.000030 zone as momentum strengthens. Source: crypto Catalysts via X
Crypto Catalysts, a crypto analyst, notes that Shiba Inu “is flashing rare bullish signs,” highlighting the price’s multiple rebounds from a horizontal support near $0.0000115 since March 2025. The current price action also shows an attempt to reclaim this critical level after briefly dipping below it.
Technical momentum indicators further reinforce the bullish case. Both the Relative Strength Index (RSI) and Moving Average Convergence Divergence (MACD) have produced bullish divergences, signaling a possible shift in momentum toward buyers. The analyst estimates that if the breakout confirms, Shiba Inu could potentially triple its value, targeting resistance around $0.000032.
Double-Bottom Formation Adds to Optimism
On the daily timeframe, Shiba Inu has formed a classic double-bottom pattern near $0.00001025, a strong indicator of price reversal. This pattern implies that the cryptocurrency has found a solid floor and could soon start climbing. The neckline of this formation sits near $0.00001765, which represents the first major target for a bullish breakout.
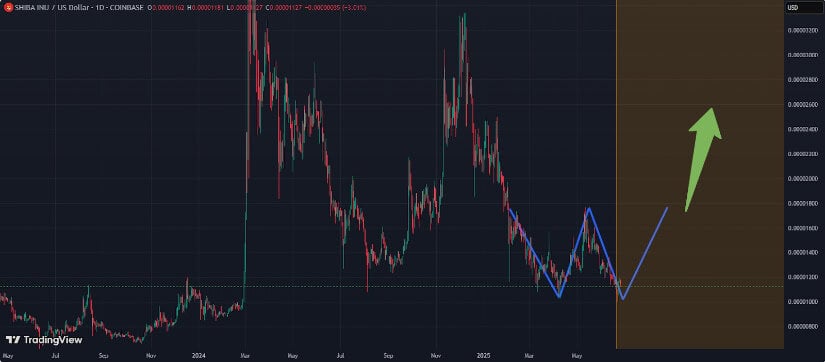
Shiba Inu appears to be forming a strong long-term double bottom (W) pattern, suggesting a key level for potential dollar-cost averaging. Source: Macromarcello2211 on TradingView
According to technical analysis principles, the price target following a double-bottom is calculated by adding the height of the pattern to the neckline level. For SHIB, this translates to a projected target of approximately $0.000025, implying a potential 115% increase from current levels.
Crispus, a market commentator, explains: “The bullish breakout often follows a double-bottom pattern as long as the price remains above the lowest point.” He adds that this scenario remains valid unless Shiba Inu dips below the $0.00001025 support, which WOULD invalidate the bullish setup.
Whale Capitulation Amidst Rising Prices
Despite these encouraging signs, Shiba Inu faces headwinds from whale activity. Large holders—defined as addresses holding between one million and one billion SHIB tokens—have been steadily reducing their stakes since late 2024. Santiment data shows a notable decline in whale holdings, which typically signals bearish pressure since these experienced traders often lead market moves.
Yet, analysts suggest that the broader crypto market environment could offset this bearish factor. The positive outlook on Bitcoin, driven by shrinking exchange reserves and easing geopolitical tensions, may fuel altcoin rallies, including SHIB’s. Since altcoins usually follow Bitcoin’s trend, a Bitcoin rally could boost Shiba Inu’s prospects despite whale selling.
Consolidation Indicates Sideways Trading Ahead
While the long-term charts favor a bullish breakout, short-term trading reflects a more cautious tone. According to Denys Serhiichuk, SHIB’s price may continue moving sideways within the range of $0.000011 to $0.0000125 for the remainder of June. This consolidation phase can serve as a base before any significant breakout or breakdown.
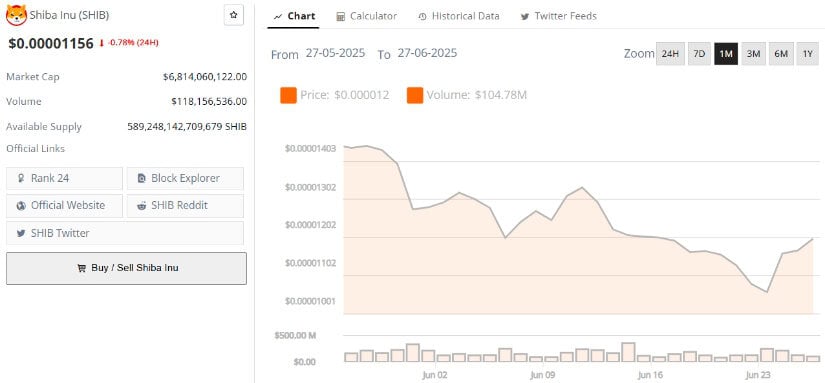
Shiba Inu (SHIB) was trading at around $0.00001156, down 0.78% in the last 24 hours at press time. Source: Brave New Coin
Serhiichuk adds that a daily close below $0.0000115 could extend the current correction toward lower support levels. However, the weekly chart still shows equilibrium, indicating neither buyers nor sellers have fully taken control.
What Traders Should Watch Next
To confirm the bullish reversal, investors and traders should monitor a few critical factors:
- Breakout above the descending wedge and double-bottom neckline around $0.00001765.
- Sustained bullish momentum confirmed by RSI moving above 50 and MACD crossover.
- Continued volume support to fuel the breakout.
- Shiba Inu price maintaining above $0.00001025, the key support to keep the bullish pattern intact
If these conditions align, Shiba Inu could potentially surge past $0.000025 and even test $0.000032, representing a substantial gain for holders.
Looking Forward
Shiba Inu’s technical landscape is shaping up for a significant move. Several indicators such as the descending wedge and double-bottom formations indicate that the meme coin is likely to enter a strong rally phase soon. In spite of continued whale selling, overall bullish sentiment within crypto markets, particularly surrounding Bitcoin, might take SHIB’s price upwards.
Short-term consolidation will occur, but medium-term-wise there is every possibility that the price will gap higher above $0.000025. Traders need to monitor key support and resistance very closely to enter and exit their positions at the right time.
