BNB Price Alert: Dip Below $600 Sparks Fierce Rally—$670 Target in Sight

Binance Coin just flashed a classic 'blood in the streets' buy signal—and traders are pouncing.
The crypto heavyweight briefly nosedived below $600 this week, triggering what analysts call a textbook capitulation event. Now, the stage is set for a potential 12% surge toward $670 as panic sellers get left behind.
Why this bounce could have legs:
Market depth charts show massive bid walls forming at $590—institutional players aren't letting this dip go to waste. Meanwhile, perpetual swap funding rates flipped negative during the drop, creating ideal conditions for a short squeeze.
The cynical take:
Of course, this could just be another 'dead cat bounce' before the next leg down. But with Binance's quarterly burn mechanism looming? Even the bears are hedging their bets.
One thing's certain: in crypto, 'oversold' is just another word for 'opportunity'—until it isn't.

The quick rebound has brought the token back above 640 USDT, with short-term indicators hinting at a potential shift in market sentiment. Rising open interest and strong trading volume support the case for continued upside if momentum holds. Traders are closely watching whether BNB can break through the 650 USDT resistance and sustain higher levels.
Short-Term Price Action and Structural Shift
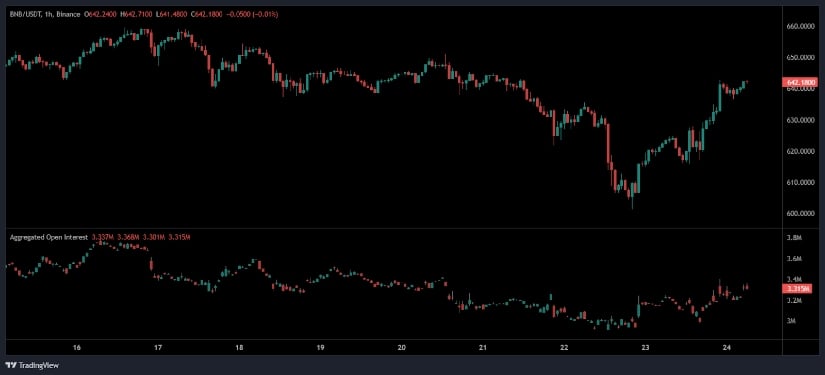
Over the last ten trading days, the 1-hour chart for BNB/USDT highlights a two-part structure. Between June 15 and 17, the price advanced steadily, reaching the 660 USDT zone before reversing course. What followed was a pronounced downtrend characterized by a sequence of lower highs and lower lows. This decline culminated in a strong sell-off on June 22 that briefly pushed BNB below 600 USDT, marking a possible capitulation point.
Source: Open Interest
The recovery began swiftly after the downturn, with price action reclaiming the mid-640s by the end of the session. This recovery leg has now pressed into the former breakdown zone NEAR 650 USDT, which serves as immediate resistance. Whether BNB can sustain upward pressure beyond this level will determine the likelihood of a retest of the 660–670 USDT range. The bounce indicates renewed buying interest, but confirmation through further gains is still needed.
Binance Coin Price Prediction: Open Interest and Volume Indicate Market Engagement
Aggregated open interest data from derivatives markets offers supporting context for the observed price movements. Open interest peaked above 3.36 million contracts when BNB price prediction was trading near 660 USDT, but declined consistently as the price dropped.
This pattern reflects the closure of long positions rather than aggressive short selling, suggesting a reduction in Leveraged exposure. On June 22, open interest fell below 3.0 million contracts, aligning with the sell-off and indicating trader exit.
Source: Brave New Coin
As BNB rebounded, open interest climbed again toward 3.32 million, suggesting that traders are gradually re-entering the market. The measured increase implies that new positions are being added during the recovery, though leverage is lower than before.
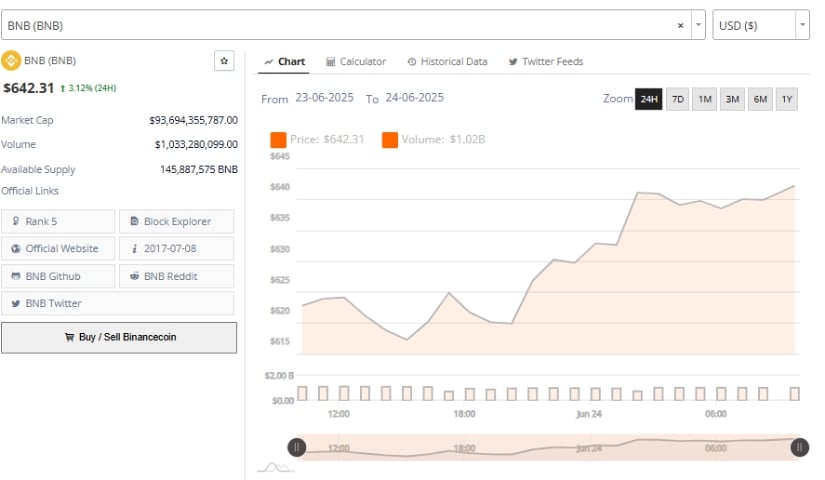
Simultaneously, trading volume over the past 24 hours reached $1.03 billion, supporting the upward MOVE from below $620 to approximately $642.31. Rising volume during this trend reflects genuine market participation, strengthening the likelihood of sustained price action.
Larger Trend Indicators Remain Cautious
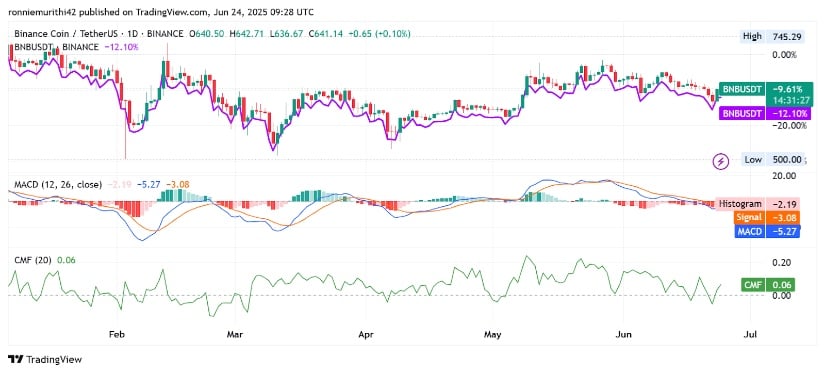
Despite recent gains, the broader market structure shows that Binance Coin price remains in a longer-term downtrend. From its high of $745.29 earlier in the year, BNB has declined by around 12.38% year-to-date. The daily chart illustrates a series of bearish and bullish candles that reflect consolidation near a support zone around $600. Any continued upward movement will need to clear resistance at $650–$660 to establish a new bullish trajectory.
Source: TradingView
Technical indicators paint a mixed picture. The MACD currently signals bearish momentum, with the MACD line below the signal line and a negative histogram reading of -2.32. This suggests that downward pressure remains, though the narrowing of the indicator lines could point to a potential shift.
Meanwhile, the Chaikin Money Flow sits at 0.05, indicating mild capital inflow but not at levels that WOULD confirm a sustained uptrend. Traders are likely to wait for stronger signals before confirming a reversal.
In conclusion, BNB’s recent price recovery is supported by improving volume and cautious re-entry by derivatives traders. A move above 650 USDT, backed by increased open interest and volume, could open the path to the 670 USDT range. However, failure to maintain support above 630 USDT could trigger a retest of the 610–600 USDT zone, keeping the broader trend in a neutral-to-bearish phase.
