Chainlink Price Prediction 2025: Where Will LINK Go Next as the Altcoin Consolidates?

Chainlink's LINK token is stuck in a holding pattern. After a volatile year, the oracle network's native asset has settled into a tight range, leaving traders to wonder: is this the calm before another storm?
The Consolidation Conundrum
Market chatter focuses on whether this sideways action signals accumulation or distribution. Bulls see a classic coiling spring—a necessary breather before the next leg up. Bears whisper about fading momentum and a potential breakdown. The charts aren't telling a clear story yet.
Beyond the Price Feed
Forget the ticker for a second. Chainlink's real narrative isn't written on exchanges; it's being coded into smart contracts. The network continues to onboard institutional partners, weaving its oracle services deeper into the fabric of decentralized finance. Each new integration is a vote of confidence, though Wall Street would probably call it 'optionality' and charge a consulting fee.
The Macro Squeeze
LINK isn't trading in a vacuum. Broader crypto sentiment, regulatory whispers, and equity market flows all exert gravitational pull. The token needs a catalyst to break free—a major protocol upgrade, a surprise partnership, or a sudden surge in real-world asset adoption on its platform.
Prediction or Guesswork?
Let's be honest: anyone claiming to know the exact price target is selling something. Technical analysis gives us probabilities, not promises. The current consolidation sets the stage for a volatile move. The only question is the direction.
Watch the key support and resistance levels. A decisive break above the range high could trigger a rush of algorithmic buying. A failure below support might see panic selling from weak hands. In crypto, patience isn't just a virtue—it's a survival tactic. LINK's next major move will likely define its trajectory well into 2026.

The breakout or breakdown of LINK price may be decisive and thus mark the next significant move.
LINK Support, Open Interest Trends, and Market Trend
Technically, the Coin indicates the intraday support of $13.20-$13.30 as a key zone of support. There has been several occasions when price has responded positively in this direction thus it shows that there is a demand.
Recent candles are a small recovery, nevertheless, the recovery itself lacks any significant momentum that WOULD support the current range-bound condition.
Aggregated Open Interest declined during the sell-off, suggesting position unwinding rather than aggressive short accumulation. This supports the idea that the MOVE lower was corrective.

Source: Open Interest
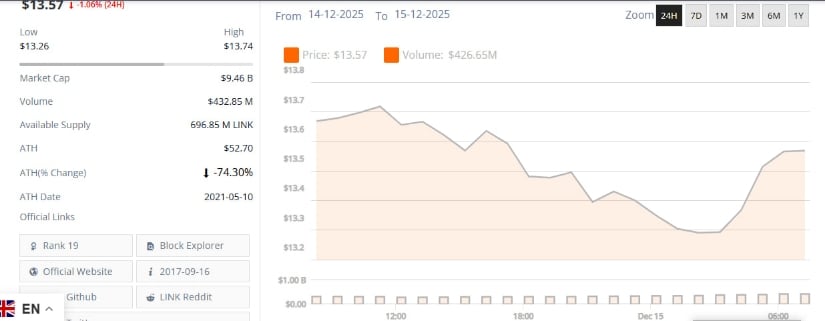
The token has moved around a narrow band in the last 24 hours, with a high of approximately $13.74, and a low of approximately $13.26.
The price has gone down about 1% today, indicating gradual selling pressure associated with the overall weakness in the crypto market and is not a result of panic selling. Volume is still good at over $430 million indicating that it is actively involved without indication of giving up.
LINK Price Consolidates Near $13.57 as Volume Stays Firm Amid Mild Recovery
The LINK chart of 24 hours depicts the short-term weakness and a slight recovery after that, the price being approximately at $13.57, which is down by about 1% on the day.
Price moved in a fairly narrow band between a high of approximately $13.74 and a low of approximately $13.26 and this represents consolidation and not high directional movement.
The steady selling pressure throughout the session is indicated by the downtrend, which may not have been as a result of panic selling but probably due to the overall market weakness.
Source: BraveNewCoin
Volume is also healthy, exceeding $430M which indicates active involvement with no give up. The recovery to the $13.25–$13.30 area indicates that there was a definite intraday support zone in which the buyers intervened. The recovery, however, hit a check at the lower zone of below $13.75 which has become near-term resistance.
LINK Daily Downtrend Persists Despite Support Stabilization
On the day-to-day timeframe, the token is also keeping a low profile with the LINK trading in a larger downwards trend. Price has taken a series of lower highs and lower lows after surging up to the $2728 region in the course of the year.
The coin currently is floating around a historic and significant support zone of $13-$14 which was earlier a consolidation and demand zone.
Volume has declined compared to the distribution phase NEAR the highs, indicating that selling pressure is easing.
However, momentum indicators such as the MACD remain below the zero line, maintaining a bearish bias despite slight improvement. This suggests stabilization rather than a confirmed reversal in the coin.
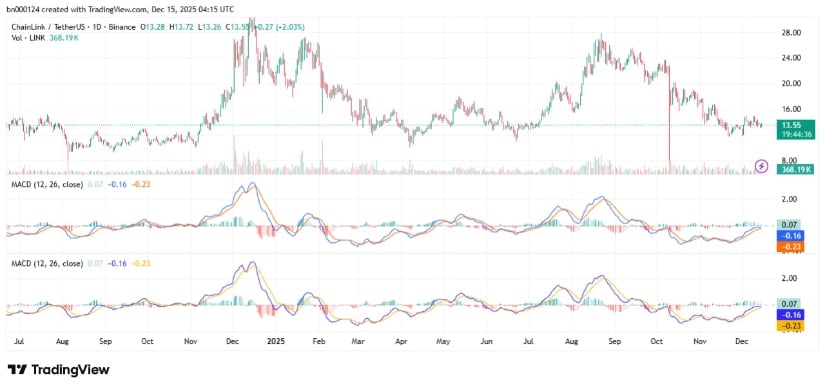
Source: TradingView
It would be beneficial to see a long-term movement of over $13.80 -$14.00, and then a solid close above $15 -$16 to turn the long-term trend in favor of the bulls.
Loss of $13.25 may lead to a downside risk of the token, which may be extended to a range of $13.00 against the down option to $11-$12, should selling pressure intensify.
