Ethereum at a Crossroads: Will $3,150 Support Hold After Sharp Rejection at $3,400?

Ethereum's rally just hit a wall. The $3,400 resistance proved too strong, sending the price tumbling back toward a critical support zone. Now, all eyes are on the $3,150 level—will it hold, or is a deeper correction coming?
The Bullish Case: Foundation or Fault Line?
For the bulls, this $3,150 area isn't just another number on a chart. It's a convergence zone—a place where previous resistance turned support, aligning with key moving averages. A strong bounce here would paint the recent rejection as a healthy consolidation, a mere pause before the next leg up toward yearly highs. The narrative would shift back to network upgrades, institutional adoption, and its entrenched role as digital finance's backbone.
The Bearish Reality Check: Pressure at the Gates
But the market's memory is short, and sentiment is fickle. A decisive break below $3,150 opens the trapdoor. The next major support sits much lower, and such a move would confirm the rejection at $3,400 as a significant distribution top. It would trigger stop-losses, invite short sellers, and shift the conversation to overcrowded Layer-2s, regulatory overhang, and that age-old question: 'Is the 'ultrasound money' narrative just another sales pitch?'
Watch the Sequence, Not Just the Price
The key isn't just the price level, but how ETH interacts with it. A swift, high-volume reclaim of $3,150 suggests accumulation. A slow, grinding bleed below it signals distribution. Monitor Bitcoin's correlation—no major altcoin truly decouples in a risk-off environment—and keep an eye on futures funding rates. Are leveraged longs still greedy, or has fear set in?
Final Tally: A classic battle between technical structure and trader psychology. Ethereum stands at a pivot point that will define its trend for weeks to come. Remember, in crypto, 'support' is just a level everyone agrees on until they suddenly, and expensively, don't—much like the value of a traditional bank's goodwill during a crisis.

After hitting resistance, ethereum entered a minor correction, testing key support zones that have historically influenced market momentum. Analysts suggest that accumulation near $3,150 could serve as a foundation for a potential rebound, while a breach may expose lower support near $2,800.
Ethereum Price Today: Market Holds Steady Amid Short-Term Correction
Ethereum (ETH) is trading around $3,200 today after facing resistance at $3,400, with investors closely monitoring the $3,150 support zone. Short-term corrections have prompted cautious sentiment, but on-chain data shows notable accumulation levels that could influence the next move.
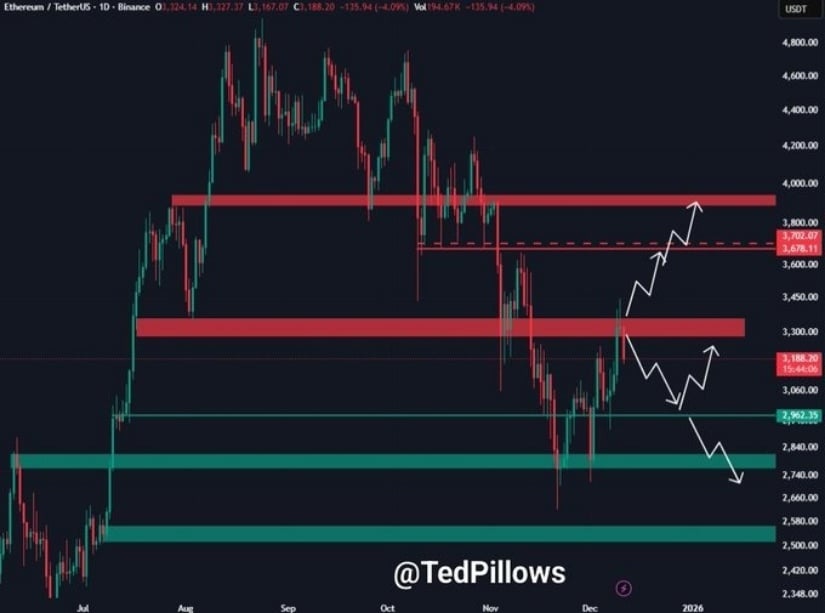
$ETH faces a sharp rejection at $3,400, testing $3,000–$3,100 support, with a bounce potentially sparking a rally or a drop toward $2,800. Source: @TedPillows via X
Analysts highlight that ETH’s performance today reflects a balance between selling pressure near resistance and buying interest at key support levels. Traders are keeping an eye on volatility, macro trends, and historical patterns to gauge whether Ethereum can sustain momentum or test lower support near $2,800.
Key Support Levels to Watch
Glassnode on-chain cluster data shows concentrated holding activity at $3,150 and $2,800, indicating that these levels have historically coincided with slowed sell-side momentum. AliCharts, a crypto analyst known for on-chain cluster modeling, highlighted that roughly 2.8 million ETH tokens are held near $3,150, while 3.6 million tokens cluster around $2,800.

Ethereum shows strong support walls at $3,150 (2.8M tokens) and $2,800 (3.6M tokens), highlighting key accumulation zones. Source: @alicharts via X
“These support walls are crucial,” AliCharts said. “They have historically absorbed selling pressure and can serve as potential launch points for renewed upward movement, though past performance does not guarantee future results.”
Market observers note that if Ethereum maintains the $3,150 support, it may recover toward previous highs NEAR $3,400. Conversely, if selling pressure intensifies, ETH could test the lower $2,800 support zone. These scenarios emphasize the inherent uncertainty in short-term crypto price behavior.
Short-Term Technical Structure
TradingView analyst RexTraderSignal, who often uses EMA-based trend analysis and intraday volume patterns, pointed out that ETH has maintained a short-term uptrend with higher lows forming consistently. Price remains above the EMA 34 (an exponential moving average representing recent market trends), while EMA 89 confirms medium-term bullish momentum.
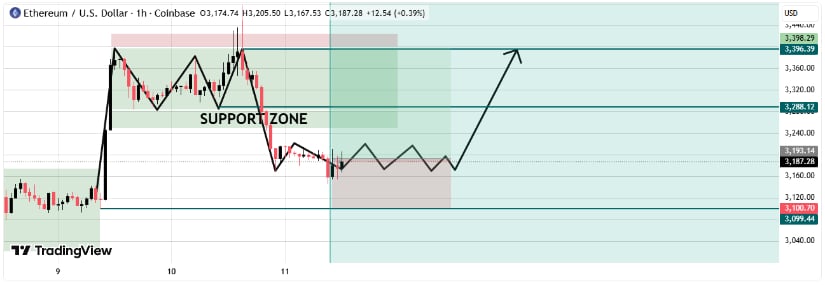
ETH maintains a short-term uptrend above key support, building energy for a potential breakout while macro conditions and BTC correlation favor bullish momentum. Source: RexTraderSignal on TradingView
“The current compression in ETH price reflects energy building for a potential breakout,” RexTraderSignal explained. “We have seen this range → liquidity sweep → expansion pattern twice before in 2025. The third accumulation cycle may favor a similar upward move, though outcomes remain dependent on broader market conditions.”
Brief definitions for clarity:
-
EMA (Exponential Moving Average): A weighted moving average giving more importance to recent prices, used to assess trend strength.
-
Liquidity sweep: A market event where the price briefly dips below support to trigger stop orders and absorb sell-side liquidity.
Historical examples show that ETH has previously rebounded from accumulation zones around similar levels ($3,100–$3,200), but occasional failures have led to swift declines toward $2,800, illustrating that no support level is guaranteed.
Macro Factors Supporting Ethereum
Ethereum’s price outlook is also influenced by broader macroeconomic conditions. A weakening US Dollar Index (DXY) and declining Treasury yields have provided tailwinds for risk assets, including cryptocurrencies. Additionally, market pricing in anticipated Fed rate cuts in 2025 could encourage liquidity to FLOW into Ethereum and Bitcoin.
“The correlation between BTC and ETH remains strong,” RexTraderSignal noted. “Historically, BTC strength often precedes upward momentum in Ethereum, but investors should consider market volatility and macro uncertainties.”
Final Thoughts
Ethereum (ETH) remains at a pivotal juncture following rejection at $3,400. The $3,150 support zone has emerged as a critical level for traders and investors, potentially influencing the next upward move.
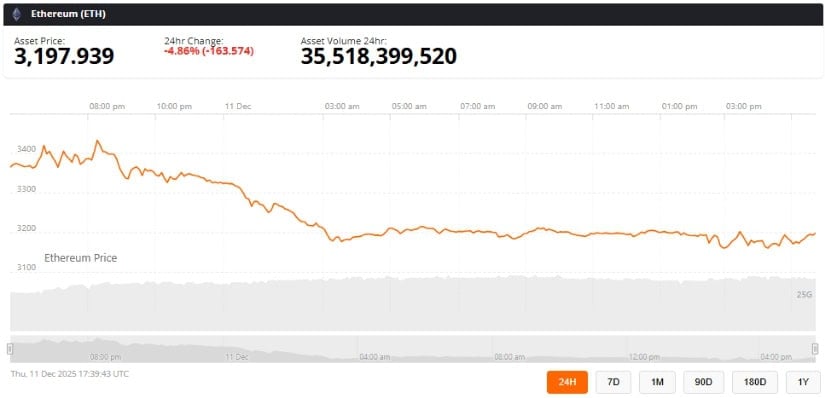
Ethereum was trading at around 3,197, down 4.86% in the last 24 hours at press time. Source: ethereum price via Brave New Coin
Current on-chain accumulation, technical indicators, and macro tailwinds suggest bullish potential, though outcomes remain uncertain. Traders and observers should monitor ETH price action alongside liquidity shifts, accumulation zones, and broader macro trends to make informed assessments in the coming weeks.
By presenting both the technical outlook and associated risks, this analysis aims to provide a balanced perspective on Ethereum’s short-term price dynamics.
