Ethereum’s Multi-Year Accumulation Base Sparks Analyst Predictions for New ATH Rally

Ethereum's price chart is whispering a secret—and the bulls are leaning in to listen.
After years of sideways action, ETH has carved out what technical analysts call a multi-year accumulation base. That's trader-speak for a prolonged period where smart money quietly builds positions while retail investors nap or panic-sell. The pattern suggests a massive spring is being coiled.
The Analyst Consensus: Up Only
The chatter from charting desks is near-unanimous. This isn't a minor breakout they're forecasting; it's a full-blown rally targeting a new all-time high. The logic is simple in hindsight: prolonged consolidation below true value often precedes explosive moves to correct that mispricing. The base, in their view, has provided the runway.
Beyond the Lines on a Screen
While the technical setup is compelling, it doesn't exist in a vacuum. It reflects a fundamental story of maturation—network upgrades settling in, institutional frameworks solidifying, and developer activity that just won't quit. The chart is finally starting to price in what the ecosystem has been building.
Of course, in crypto, a 'sure thing' is just a narrative waiting for a liquidity crisis or a regulator's tweet to unravel it. One cynic's 'accumulation base' is another's 'dead money trap'—usually depending on whether they bought at the bottom or the top.
The setup is there. The analysts have called their shot. Now, the market just has to decide whether to follow the script or, as it often does, rip it up and write a new one entirely.

According to on-chain data and recent Ethereum news, the ethereum price has been stabilizing around $3,100 following a period of range-bound activity, with observers evaluating its potential path toward higher valuation bands.
At the time of writing, the current ETH price is approximately $3,100. Analysts note that this level may act as a consolidation base, providing a reference point for potential upward momentum based on historical patterns and technical indicators.
Multi-Year Accumulation Signals Strength in Ethereum Price Analysis
Technical analysis indicates that ethereum has exhibited recurring patterns on higher timeframes. Skyodelic, a market analyst known for publishing quantitative studies on crypto RSI behavior over the past five years, observed that Ethereum’s Relative Strength Index (RSI) has recently shifted from oversold toward neutral territory.
He commented:
“Every single time the 1D RSI has moved from overbought to oversold and then broken the downtrend, it has historically experienced at least a 45% increase.”
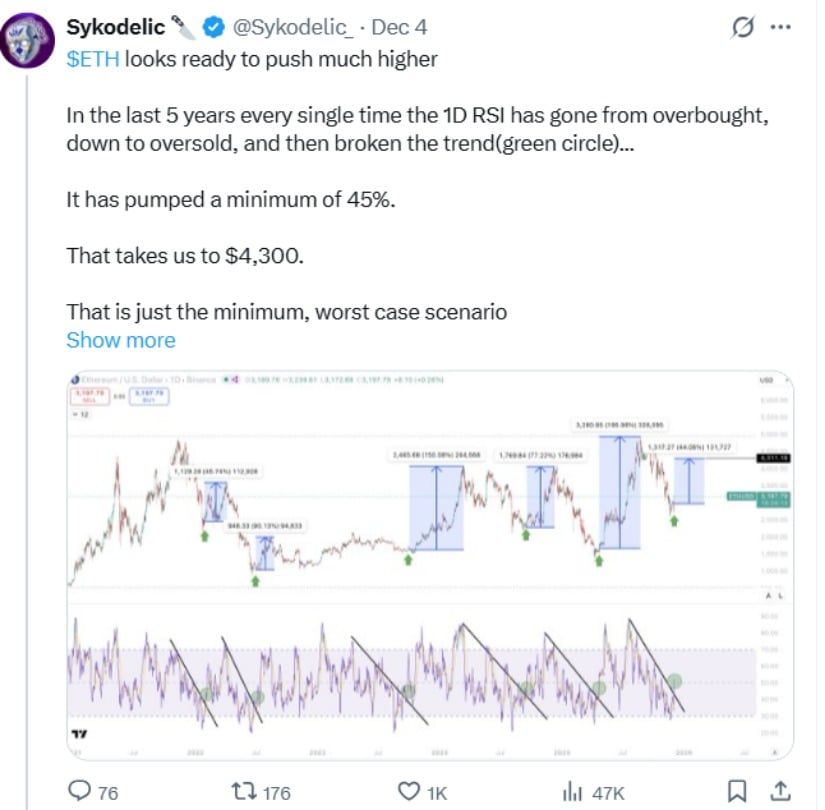
Based on historical 1D RSI trends, Ethereum’s recent breakout from oversold territory suggests potential gains of 45%–111%, implying a price range of approximately $4,300 to $6,800. Source: Sykodelic via X
While this analysis provides context for potential price action, it is important to note that past RSI behavior does not guarantee future results, particularly during periods of regulatory uncertainty, macroeconomic shifts, or network protocol changes. Analysts suggest that, under comparable conditions, conservative upside estimates could reach approximately $4,300, with extended targets NEAR $6,800 if bullish momentum aligns with trading volume.
This measured interpretation helps ground Ethereum technical analysis in observable patterns while acknowledging the limitations of relying solely on historical analogues.
Long-Term Structure: $1,800 Zone Reinforces Ethereum Price Outlook
Beyond short-term indicators, longer-term charts reveal additional accumulation signals. Analyst Ali Martinez (ali_charts), who monitors weekly ETH/USDT trends with a focus on multi-year support and resistance levels, identified $1,800 as a significant accumulation zone supported by a rising trendline originating from 2022 lows.
Ali explained:
“Ethereum at $1,800 may serve as a long-term accumulation zone ahead of a potential rally, though this is contingent on sustained market activity and macro conditions.”
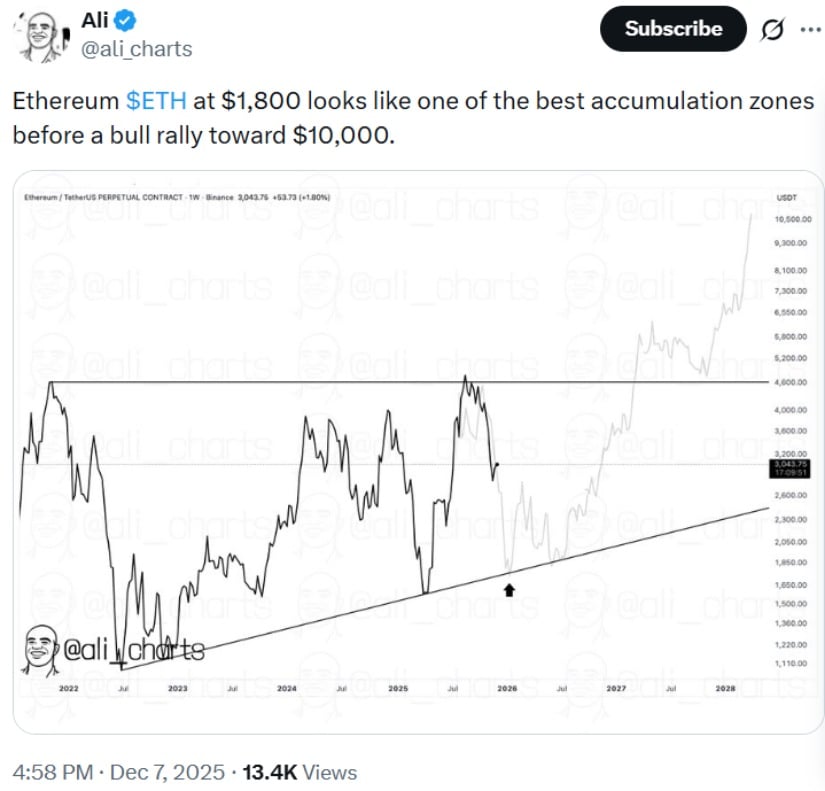
Ethereum (ETH) at $1,800 is considered a strong accumulation zone, potentially setting the stage for a rally toward $10,000. Source: Ali Martinez via X
Historically, Ethereum has posted substantial gains following prolonged bear-market consolidation, such as the 2018–2021 period, where the price of Ethereum ROSE from sub-$100 levels to its previous all-time high price near $4,800. However, market participants should treat projections like “Will Ethereum hit 10K?” as scenario-based outcomes rather than assured targets.
Exchange Supply Drops as On-Chain Data Tightens Ethereum Price Today
On-chain metrics further illustrate Ethereum’s supply dynamics. Data from Glassnode, a blockchain analytics provider, shows that only 8.7%–8.9% of Ethereum’s circulating supply is currently held on centralized exchanges. Analyst Mister crypto notes that this relative scarcity may indicate growing accumulation among long-term holders and institutional investors.
“$ETH is extremely scarce. Only 9% of supply is left on exchanges,” he stated, contextualizing the metric within broader supply trends.
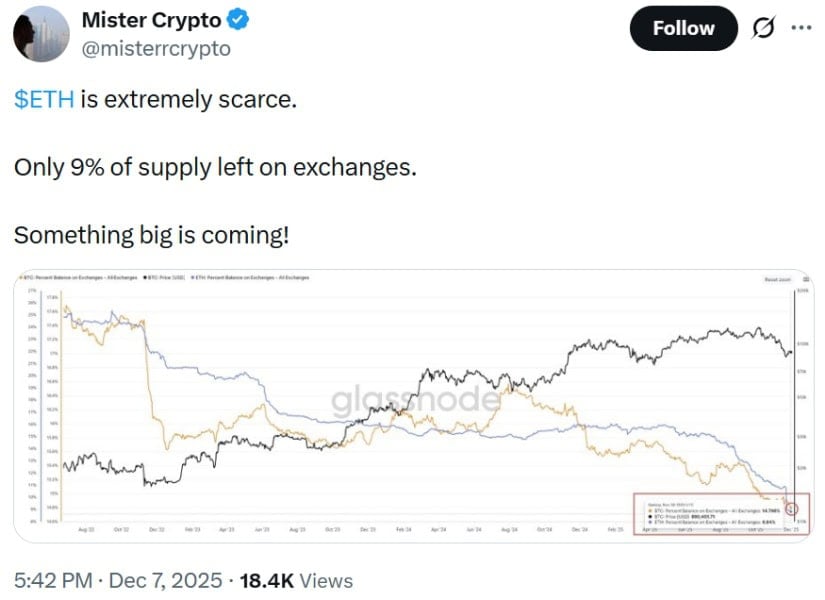
ETH supply on exchanges has dropped to just 9%, indicating tightening availability and potential upward pressure on price. Source: Mister Crypto via X
Approximately 40% of all ETH is locked in staking, custodial solutions, or institutional products, including emerging Ethereum ETF offerings like the BlackRock Ethereum ETF. These factors can influence liquidity and short-term volatility. Analysts caution, however, that reduced exchange balances do not guarantee immediate price appreciation, as market dynamics can shift due to macroeconomic conditions or sudden liquidity events.
Short-Term Structure Points to Key Ethereum Resistance Levels
Short-term charts suggest Ethereum is trading within a consolidation band. Technical traders often use models incorporating Ethereum technical analysis to monitor breakout confirmations and define potential trading zones. One blueprint, emphasizing risk management and historical resistance levels, identifies:
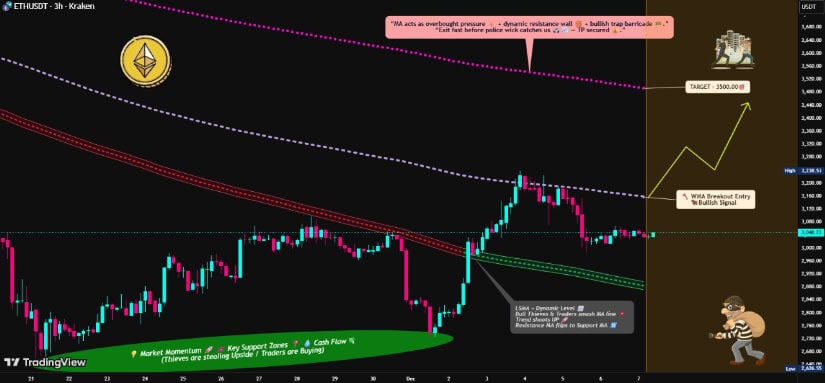
ETH/USDT shows a bullish LSMA breakout, with a $3,200 entry, a $2,900 stop-loss, and a $3,500 target, highlighting risk management. Source: The-Thief on TradingView
-
Entry confirmation: ~$3,200
-
Stop-loss/invalidation: ~$2,900
-
Initial upside target: ~$3,500
These thresholds provide context for potential short-term eth price today movements. Analysts advise using these as reference points for confirming trend strength rather than assuming deterministic outcomes.
Ethereum Price Forecast Balances Data With Market Risks
While technical and on-chain signals indicate constructive conditions, analysts recommend a cautious approach. RSI-based signals may fail during extended macro downturns or in the presence of unexpected regulatory changes. Alternative interpretations of accumulation zones, trendlines, and supply metrics suggest potential for sideways or downward price movement under adverse conditions.
The broader Ethereum forecast, including the Ethereum price prediction for 2025 and the ETH price prediction for 2030, is best considered as a scenario-based framework. These forecasts rely on historical post-bear market trends, current on-chain supply, staking metrics, and institutional adoption through ETFs. Additionally, monitoring Bitcoin and Ethereum’s relative strength can provide insight into whether ETH is likely to outperform the broader crypto market.
What’s Next for the Price of Ethereum
In the near term, stability above the $3,100 zone, combined with continued supply reduction on exchanges, may strengthen Ethereum’s underlying base. Analysts suggest that potential targets, such as $6,800 or higher, should be viewed as long-term reference points contingent on continued demand, network usage, and macroeconomic stability rather than as guaranteed outcomes.
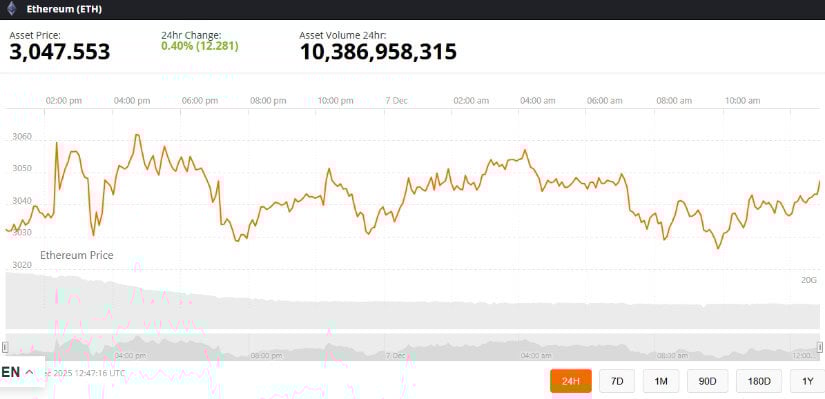
Ethereum was trading at around 3,047.55, up 0.40% in the last 24 hours at press time. Source: Ethereum price via Brave New Coin
Ultimately, the evolving Ethereum news today indicates that Ethereum’s current price structure reflects a foundation built over multiple years. Traders and long-term holders are advised to incorporate both technical indicators and market context into decision-making, emphasizing risk management and scenario-based planning.
