XRP Price Prediction: Resilience Above $2 as Liquidation Heatmap Reveals Major Buying Pressure

XRP bulls dig in above a critical support level, with market structure hinting at a major move.
Liquidation Heatmap Exposes Trader Positions
The $2 level isn't just a psychological round number—it's a battleground. The liquidation heatmap, a tool that visualizes where traders have placed their stop-loss orders, reveals a dense cluster of potential liquidations just below this price point. This creates a classic market mechanic: a break below could trigger a cascade of forced selling, but holding above it invites aggressive buyers looking to squeeze those short positions. It's a high-stakes game of chicken playing out on the charts.
Resilience Meets Real-World Pressure
Holding firm here demonstrates more than just technical strength; it shows underlying conviction. While other assets might buckle under macroeconomic pressure or regulatory saber-rattling, XRP's consolidation suggests a foundation of buying pressure that isn't easily spooked. Of course, in crypto, 'conviction' is often just another word for 'bag-holding' until the next narrative shifts—a fact every trader knows after funding their portfolio with hopes and dreams.
The Path Forward: Squeeze or Squeaze?
All eyes are on that liquidation zone. A sustained hold above $2 could force the hand of short-sellers, catalyzing a rapid upward move as positions unwind. The heatmap doesn't predict the future, but it illuminates the fuel for the next big volatility spike. Whether that spike rockets the price upward or burns through support depends entirely on which side blinks first. In the end, the market's memory is notoriously short, and today's resilient support level is just tomorrow's forgotten footnote in a trader's P&L statement.

Despite recent sideways trading, XRP’s stability above this critical floor is attracting attention from both retail and institutional participants. By examining XRP’s spot ETF filings and the Coinglass liquidation heatmap, accumulation may be quietly occurring beneath the surface, potentially setting the stage for a controlled MOVE higher.
Liquidity Clusters Signal Possible Hidden Demand
Analyzing the Coinglass XRP liquidation heatmap as of December 7, 2025, identified significant liquidity clusters around $2.25–$2.30. Historically, these zones have coincided with short-term price bounces, suggesting that Leveraged positions in this area could trigger a cascade if approached.
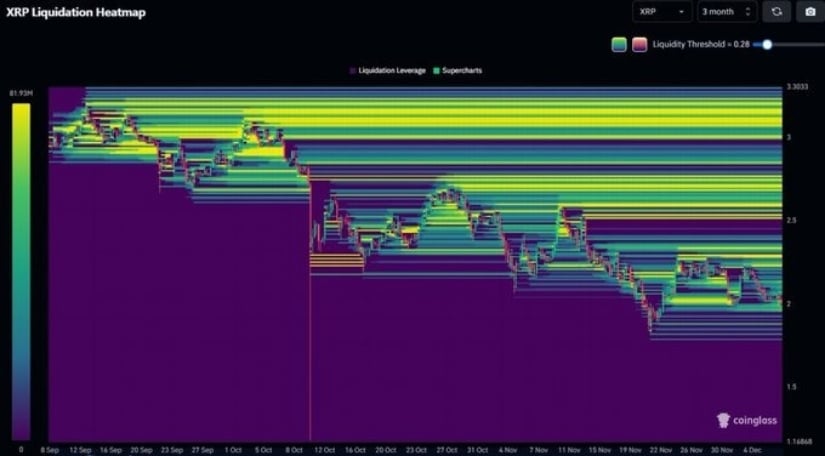
XRP’s liquidation heatmap reveals heavy upside liquidity and strong ETF demand, suggesting a rapid rally once the market stabilizes. Source: @Web3Niels via X
These liquidity “pools” or “magnet zones,” as they are sometimes called, indicate where concentrated long or short positions are at risk of liquidation. In assessment, XRP’s current proximity to this cluster implies that if the price moves toward it, forced liquidations may temporarily increase volatility but also potentially attract buying, creating a short-term support or resistance dynamic.
Diverging Signals: ETF Inflow vs Price Action
Institutional interest in XRP remains notable. Since mid-November 2025, XRP spot ETF filings indicate daily inflows averaging $12–$15 million, making XRP one of the most actively accumulated crypto ETF assets in this period.
However, despite this institutional accumulation, XRP trades around $2.03, roughly 20% below levels from early November. This divergence suggests that while ETFs continue absorbing supply, retail sentiment is subdued, creating a temporary disconnect between price action and fundamental accumulation. This pattern resembles historical setups where ETF accumulation preceded consolidation before breakout attempts.
Technical Structure: Support Holds, But Bulls Need Conviction
From a technical standpoint, XRP has repeatedly defended the $2 support zone on daily charts, indicating a resilient floor. Each bounce off this level coincided with volume spikes, reinforcing the area’s significance.
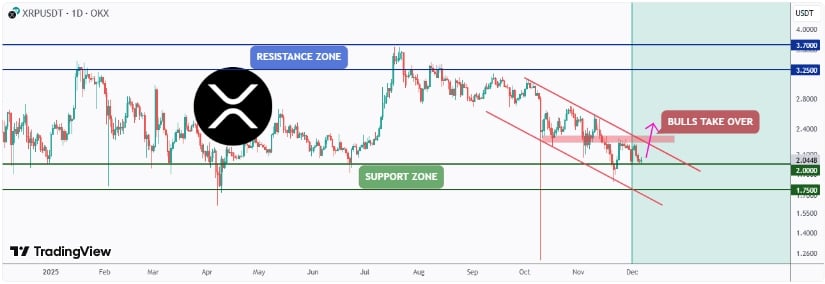
XRP remains strong above key support, with bulls defending the floor, while a break above the falling channel could trigger a larger upward move. Source: TheSignalyst on TradingView
Still, for a sustained bullish reversal, price WOULD likely need to break the descending channel and surpass recent major highs near $2.35–$2.40. Until then, it weighs short-term scenarios based on support retention:
-
Support holds: Look for measured long entries near $2.
-
Support breaks: Prepare for a potential downside toward $1.85–$1.90, which would invalidate the immediate bullish thesis.
What Is a Liquidation Heatmap and Why It Matters for XRP
A liquidation heatmap aggregates leveraged positions across exchanges, highlighting where forced liquidations, either long or short, are probable. On Coinglass, hotter zones (red or yellow) show higher liquidation concentration.
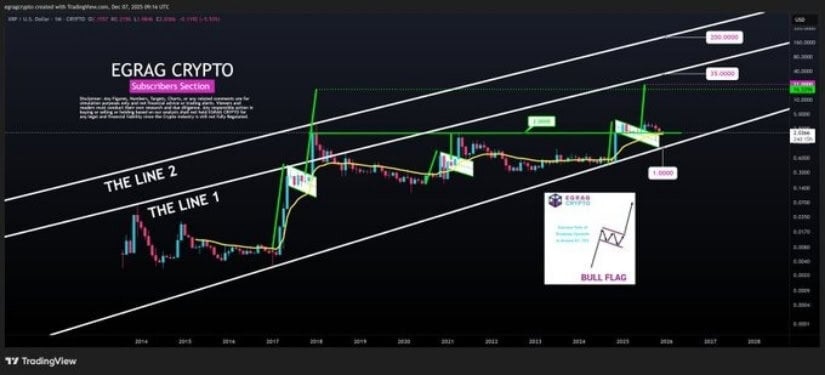
XRP holds above $2 and the 21 EMA, showing a macro bullish setup with potential upside toward key long-term targets. Source: @egragcrypto via X
Based on a review of XRP’s historical patterns, these clusters have reliably indicated short-term reaction zones. Price often “gravitates” toward them, producing either a short squeeze or temporary retracement. However, false signals are possible, particularly in thin liquidity periods or during low-volume holidays, emphasizing the importance of combining heatmap data with structural support analysis.
Applying this concept to XRP, the existing liquidity cluster around $2.25 suggests that if the price moves higher toward that zone, a significant amount of latent liquidity could be unlocked, possibly igniting a strong short-squeeze or rally.
Looking Ahead: Quiet Strength Hidden Beneath the Surface
While XRP may appear flat on surface charts, the combination of ETF inflows, defended support, and nearby liquidity clusters suggests an underlying LAYER of accumulation. The $2 floor continues to act as a stabilizing base, but traders should monitor the $2.25–$2.30 cluster for potential volatility triggers.
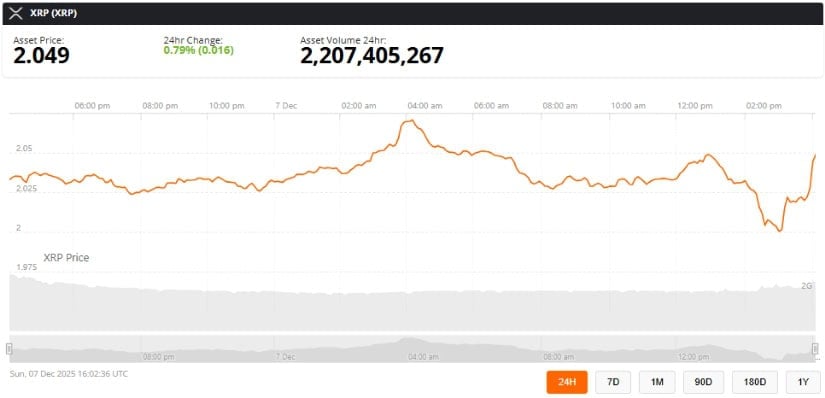
XRP was trading at around 2.04, up 0.79% in the last 24 hours at press time. Source: xrp price via Brave New Coin
The outlook remains conditionally bullish. Sustained upward momentum requires breaching the descending channel and surpassing short-term highs. Conversely, a breakdown below $2 would signal caution and possibly invite retracement. Overall, the analysis indicates that XRP’s market structure is quietly preparing for its next decisive move, with hidden liquidity likely influencing the direction.
