Litecoin Price Prediction: LTC Rebounds From $80 as Bulls Eye a Return to $100

Litecoin bulls just staged a comeback.
After a dip that sent shivers through the market, LTC found its footing at the $80 level—a line in the sand that traders refused to let break. The bounce was sharp, decisive, and has everyone asking one question: is this the start of a run back to triple digits?
The $80 Floor Holds Firm
Support didn't just hold; it screamed. The rejection from $80 wasn't a timid tap—it was a full-blown rally cry. Volume spiked on the rebound, signaling that big money wasn't just watching; it was buying. This isn't retail FOMO; it's institutional conviction painting a clear chart pattern.
The Path to $100
Clearing immediate resistance around $90 is the next checkpoint. If momentum holds—and the bid depth suggests it will—the psychological $100 barrier comes into play. That's not just another number; it's a liquidity magnet and a headline-generator that could trigger the next leg up. Technicals align with the narrative, showing a classic reversal setup that even traditional chartists can't ignore.
Market Sentiment Shifts
The fear is gone. In its place? A grinding, calculated optimism. Social metrics and funding rates are cooling from their panic highs, settling into a healthier uptrend rhythm. It's the market equivalent of taking a deep breath before a sprint—a sign of strength, not exhaustion.
Of course, in crypto, today's rally is just tomorrow's 'what were we thinking?' footnote for some fund manager's quarterly apology letter. But for now, the bulls are back in charge. Litecoin's bounce from $80 isn't just a recovery; it's a statement. The target is clear, and the momentum is building. $100 isn't a hope—it's the plan.

After a volatile start to December, Litecoin has rebounded from the $80 support zone, recovering part of its earlier losses. TradingView data shows the asset retreating from a monthly high near $110 before stabilizing around $80.40 as of December 6, 2025, marking a weekly decline but highlighting signs of short-term recovery after a strong intraday bounce.
A commonly referenced 4-hour LTC/USDT chart on TradingView indicates that price reacted at the same support zone that has held multiple times during 2025. This recurring pattern suggests that the $80 level remains influential. While some traders interpret this as an early signal of a potential recovery toward the $100 area, such outcomes depend on broader market conditions and sustained buying interest rather than the chart structure alone.
Historical Support at $80 Continues to Prove Its Strength
Historical data from Yahoo Finance and Investing.com show several instances in 2025 where Litecoin retraced toward the $80 level and rebounded shortly afterward. Recent records indicate no daily close below $74 during the early December decline, reinforcing the level’s significance.
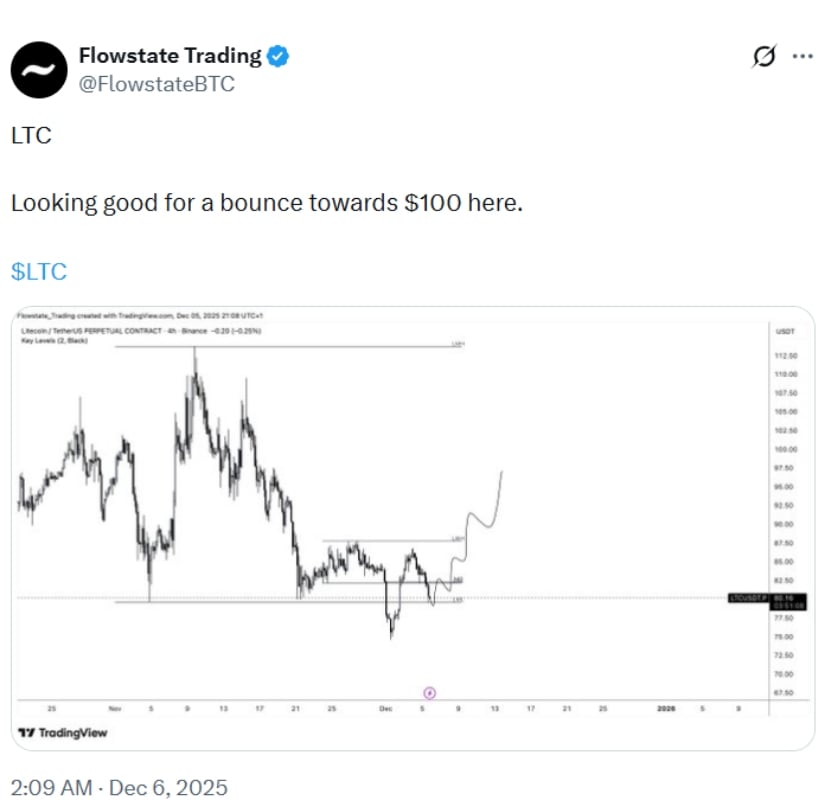
Litecoin appears poised for a potential rebound toward the $100 level. Source: @FlowstateBTC via X
Long-term price action also aligns with a multi-year horizontal support region between $62 and $65, visible in charts covering 2017–2025. This range overlaps with the 78.6% Fibonacci retracement measured from the 2021 high. Trader @EasychartsTrade, who frequently publishes technical commentary and states experience in blockchain-focused trading roles, described Litecoin as a “true OG,” noting that the confluence of long-term support zones may offer “accumulation value” for certain investors. This view reflects his personal interpretation of the chart rather than a consensus outlook.
Some analysts who track on-chain activity and derivatives behavior estimate that Litecoin could retest the $95–$106 range later this month if current support levels continue to hold. These projections are conditional and depend on factors such as volatility in Bitcoin, ETF-related flows, and shifts in market sentiment.
Market Sentiment and ETF Developments Bolster Retail Confidence
Market sentiment improved slightly this week following Vanguard’s decision to expand access to third-party crypto ETFs, including the Canary Litecoin ETF (LTCC). Although Vanguard is not offering direct exposure, the move allows its platform users to access certain crypto-linked products, which has contributed to renewed interest from retail participants exploring diversified investment options.
ETF FLOW data from Sosovalue shows that LTCC recorded net-zero inflows on December 1–2, with cumulative inflows at approximately $7.67 million as of the same period. While modest, the stable inflow profile suggests that holders are not exiting positions despite market uncertainty.
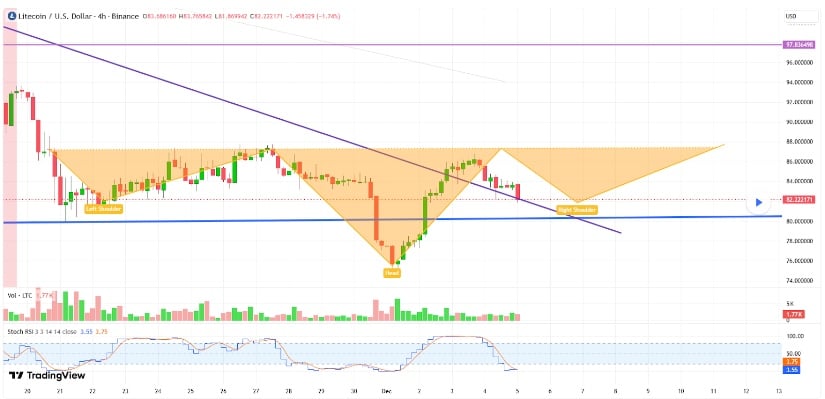
LTC is nearing completion of an inverted head-and-shoulders pattern with growing volume, suggesting a potential MOVE toward the $95–$98 range. Source: bradhakiran on TradingView
The derivatives market showed a more notable shift. According to CoinGlass data as of December 6, Litecoin futures Open Interest increased 4.41%, rising to around $440.26 million. Short liquidations reached $753,910, exceeding long liquidations, which may indicate traders unwinding bearish positions amid short-term volatility.
CryptoQuant’s large-wallet transaction metrics also show an uptick in average order size from addresses often associated with institutional or whale activity. While this does not guarantee upward price movement, such behavior is typically associated with periods of accumulation or increased confidence in medium-term price stability.
Technical Outlook: Litecoin Flashes Bullish Potential as Momentum Shifts
A review of Litecoin’s daily chart suggests that the asset continues to trade within a falling wedge—a pattern that is often, though not always, associated with potential bullish reversals. The price recently rebounded from a trendline connecting the October 17 and November 4 lows, keeping the structure intact.
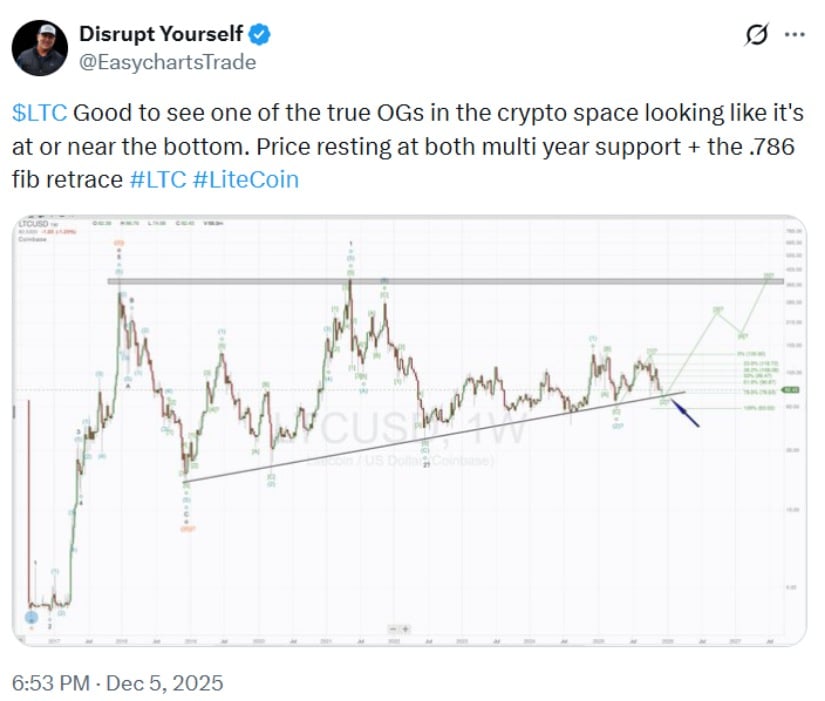
LTC is showing signs of bottoming as it holds multi-year support and the 0.786 Fibonacci retracement level. Source: @EasychartsTrade via X
If momentum continues, Litecoin could test the 50-day EMA at $92.94 and the 200-day EMA at $99.51, based on the current indicator readings on TradingView. These levels FORM key overhead barriers and typically require sustained volume to break convincingly.
Momentum indicators present mixed but improving signals:
The RSI has recovered to approximately 45, indicating reduced selling pressure.
The MACD is approaching a potential crossover above the signal line, which may suggest strengthening momentum if confirmed in the coming sessions.
However, analysts who track Bitcoin correlation note that Litecoin remains sensitive to Bitcoin’s directional shifts. Technical commentator @cryptoWZRD_, known for daily market breakdowns, pointed out that Litecoin recently closed below several internal resistance levels, making its short-term structure dependent on broader crypto sentiment.
Their analysis highlights $79.60 as an important support level to monitor. Immediate resistance stands NEAR $86.60, and a clearer trend is likely to emerge only if the price structure matures beyond the current consolidation range. The author advises caution during periods of elevated weekend volatility, which historically impacts Litecoin’s intraday price movement.
Price Predictions and Outlook for December 2025
Short-term LTC price predictions suggest that volatility may persist around the $80–$90 range. Some chart-based models indicate the possibility of a move toward $91–$104 if the broader market stabilizes and Litecoin maintains its current support structure. Intraday analyses also highlight an inverted head-and-shoulders formation that could target $95–$98, although pattern reliability depends on confirmation through volume.
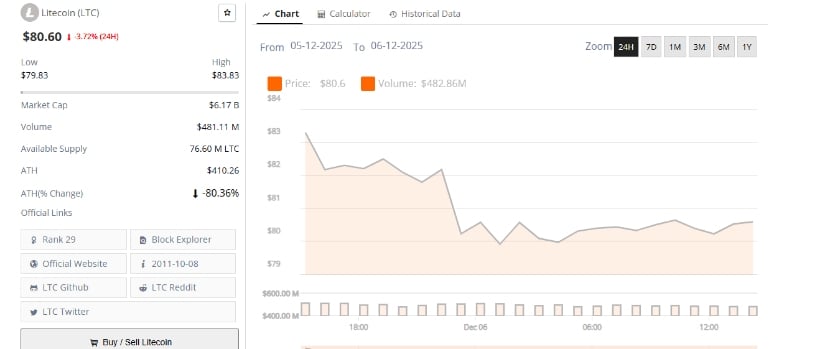
Litecoin was trading at around $80.60, down 3.72% in the last 24 hours. Source: Brave New Coin
Longer-term Litecoin predictions for 2025 remain cautious. Certain forecasting tools place the average projected price around $92.54, though these figures are based on historical behavior and technical assumptions rather than guaranteed outcomes. A break above $134.19—a major resistance noted by multiple analysts—could support a larger bullish continuation pattern, but confirmation WOULD require stronger participation from both derivative markets and spot buyers.
Key technical levels frequently referenced by analysts include:
-
Support: $77.44–$79.92
-
Resistance: $86.05–$90.36
-
Major breakout level: $134.19
While these levels provide structure for ongoing analysis, Litecoin’s direction in the coming weeks will likely depend on broader crypto market behavior, shifting liquidity conditions, and reactions to evolving ETF and derivatives data.
