XRP Price Prediction: Double Bottom Near $1.80 Signals Potential Reversal Toward $2.70 Despite Market Weakness

XRP's chart just flashed a classic reversal signal most traders dream of—right as the broader market wobbles.
The Technical Setup: A Double Bottom's Promise
Price action has carved a distinct 'W' pattern, finding stubborn support around the $1.80 level—not once, but twice. That double bottom is the technical foundation for the current bullish argument. It suggests the selling pressure at that price point has been exhausted, twice over.
Targets and Resistance: The Path to $2.70
The measured move from this pattern's neckline points toward a potential rally eyeing the $2.70 zone. It's not a guarantee, but it's the roadmap the chart is handing out. Getting there means cutting through overhead supply—each prior resistance level becomes a mini-battle on the climb.
Defying the Downtrend: Strength Against the Grain
Here's what makes this noteworthy: the setup is forming despite a backdrop of general market weakness. While other assets flounder, XRP is attempting to build a base and stage a solo run. That kind of relative strength often gets portfolio managers' attention—right before they write a newsletter about their genius timing.
The bottom line? The pattern suggests a local low is in. If it holds, the path toward $2.70 is technically open. Just remember, in crypto, even the prettiest chart can be undone by a single tweet from a billionaire having a bad morning.

Following a period of consolidation, XRP’s price movements are beginning to reflect classic reversal signals. Reduced volatility, measured buying activity, and observed chart patterns indicate that short-term directional changes may be emerging, though risks remain in a volatile crypto environment.
Double Bottom Formation Strengthens Bullish Case
According to TradingView analyst Steph iscrypto, XRP’s 4-hour chart shows a double bottom pattern NEAR the $1.80 support level, with two successful rebounds over recent sessions. This formation is often interpreted as an early indication of a potential bullish reversal if confirmed by subsequent price action.
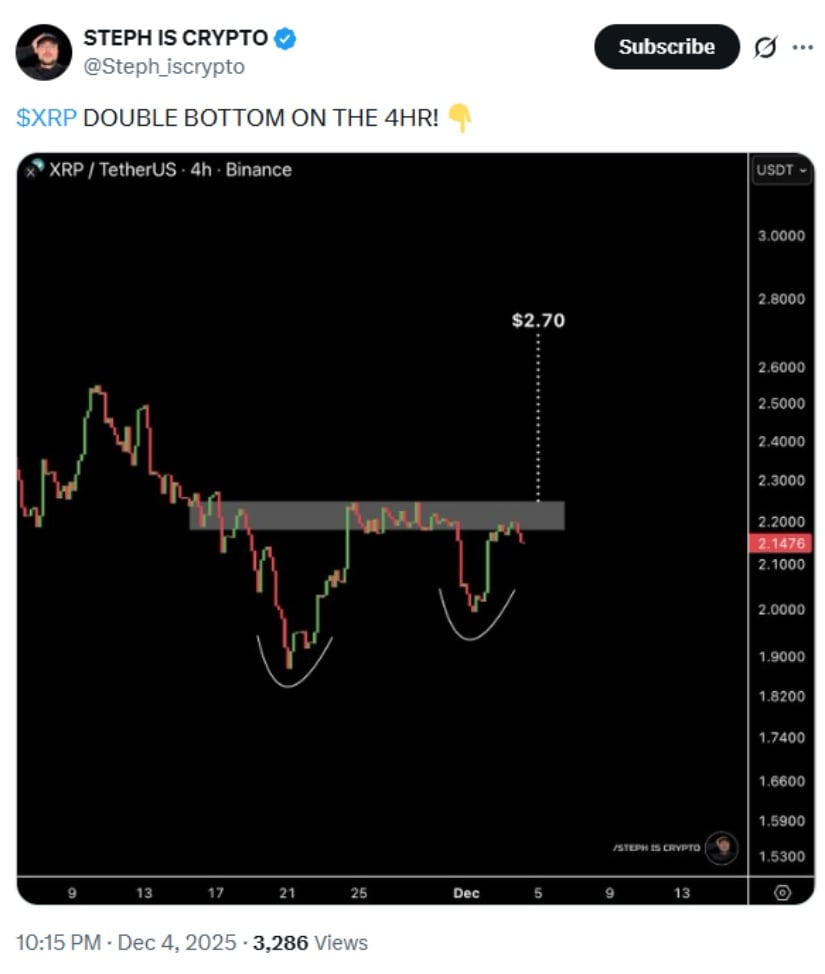
As of December 4, 2025, XRP trades around $2.15 after a 4-hour double bottom near $1.80, signaling a potential bullish MOVE toward $2.70–$3.10. Source: STEPH IS CRYPTO via X
As of December 4, 2025, at 14:00 UTC, XRP is trading at approximately $2.15. Analyst Steph is crypto notes that a sustained move above $2.22, confirmed by above-average volume, WOULD be necessary to validate the pattern. If confirmed, measured move calculations suggest a potential resistance near $2.70.
It is important to note that the double bottom scenario carries risk. A failure to hold $2.00 support would invalidate the pattern, indicating that the broader downtrend could persist.
Market Weakness Persists Despite Local Support
Despite the double bottom formation, broader market data shows continued downward pressure on XRP today. According to TradingView XRP/USDT chart data as of December 5, 2025, the price remains around $2.09, unable to sustain rebounds above intermediate resistance.
Spot market flows reported by Santiment indicate approximately $1.5 million in net outflows on December 5, reflecting steady distribution rather than panic selling. This lack of new capital inflows highlights the importance of monitoring liquidity to assess the sustainability of any bullish momentum.

XRP/USDT is trading sideways under the $2.5–$3.0 bearish order block, with neutral RSI and weak MACD, keeping the short-term bias neutral to bearish until a clear break confirms direction. Source: tomas_jntx on TradingView
Additional technical metrics reinforce caution. Open interest in XRP futures decreased by 4.37%, while RSI remains near the mid-40 range and MACD shows minimal upward momentum. Historical analysis suggests that these readings typically indicate weak trend conviction and a neutral-to-bearish short-term outlook.
Fear Zone Readings Offer Contrarian Insights
Sentiment analysis provides a nuanced perspective on XRP’s near-term outlook. According to Santiment’s Fear & Greed Index, XRP reached one of its highest fear levels since October 2025, suggesting investor caution.
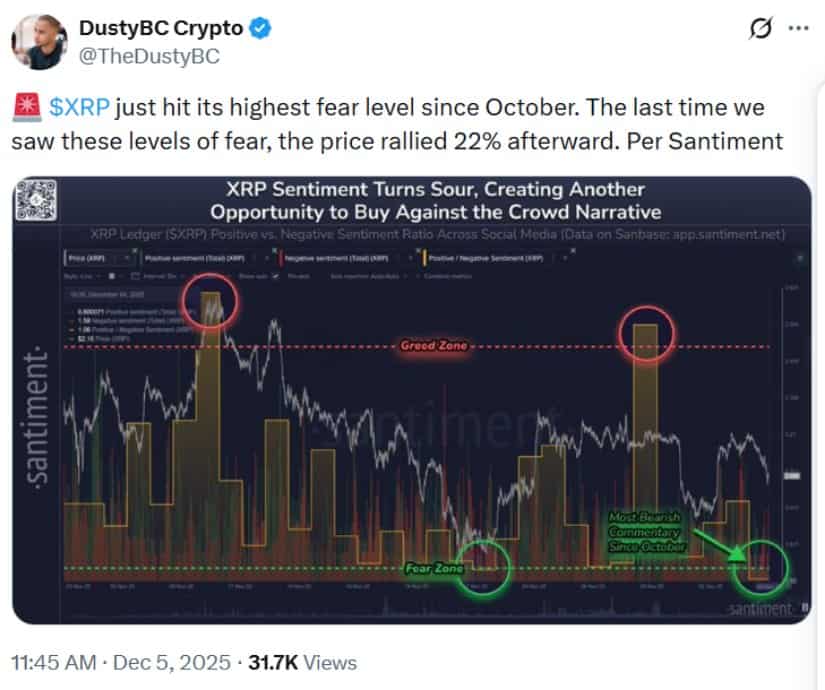
XRP’s social sentiment has dropped to its lowest since October 2025, entering a “fear zone” that historically signals potential bullish reversals. Source: DustyBC Crypto via X
Historically, sentiment extremes have coincided with short-term price recoveries. Santiment data shows that a similar spike in bearish sentiment on November 21, 2025, preceded a 22% price rebound within three days. While past performance does not guarantee future results, behavioral finance research—including studies in the Journal of Behavioral Finance (2020)—supports the idea that market mispricing can occur during periods of heightened fear.
Traders should interpret these signals as informational rather than predictive. Market response depends on upcoming flows, macroeconomic conditions, and regulatory developments affecting Ripple and XRP.
Analysts Split as Long-Term Narratives Emerge
Long-term XRP projections remain diverse. A monthly chart pattern highlighted by crypto analyst Jainam Mehta shows a potential bullish flag, suggesting a measured technical target of $15. Mehta notes that institutional demand, including ETF-related accumulation, could affect available liquidity but emphasizes that this target is speculative and contingent on confirmed technical breakouts.
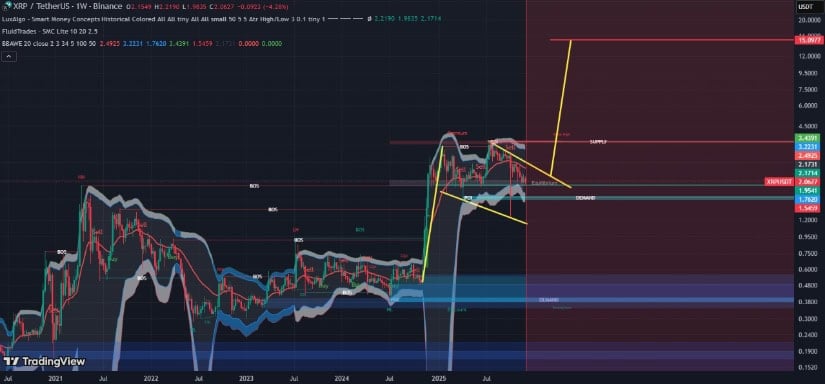
XRP’s monthly chart shows a bullish flag, with potential targets from $5–$25 up to $500+ under extreme supply and institutional scenarios. Source: Soul_Investments on TradingView
Conversely, other analysts maintain a cautious stance. Observations show that the $2.40–$3.00 zone continues to act as a bearish order block. Technical readings, such as RSI near 50 and minimal MACD divergence, indicate limited momentum, suggesting that upside potential remains constrained until the resistance cluster is decisively breached.
Key Levels to Watch Moving Forward
Traders and observers should focus on the following levels for context on xrp price dynamics:
-
$2.00 support: Psychological and technical floor that has held since November 2025. Breach could expose $1.88 and $1.72 as potential liquidity zones.
-
$2.22 resistance: Short-term breakout level linked to the double bottom pattern.
-
$2.30–$2.40 resistance cluster: A reclaim here would suggest the first meaningful structural shift in months.
-
$2.70 target: Measured move objective from the confirmed double bottom; remains contingent on sustained volume and technical confirmation.

XRP was trading at around 2.06, down 4.49% in the last 24 hours at press time. Source: XRP price via Brave New Coin
Until these levels are decisively tested, XRP remains in a structurally cautious state, with the market awaiting clear directional signals. Investors and traders should balance the technical insights with ongoing monitoring of liquidity flows, regulatory news, and broader macro conditions.
