Sei Price Prediction 2025: Pulls Back to $0.14 as Open Interest Eases After Sharp Squeeze

Sei's price action just took a breather—and the charts are telling a story of leverage unwinding. After a sharp squeeze rattled the market, open interest is finally cooling off. That $0.14 level isn't just a number; it's a battleground where short-term panic meets long-term structure.
The Squeeze is Over. Now What?
Liquidations cleared the decks. Aggressive longs got washed out when funding rates spiked, and now the market's finding its footing. This isn't a breakdown—it's a healthy reset. The pullback to $0.14 acts like a pressure release valve, letting overheated positions exit before the next leg. Open interest dropping means less speculative froth and more genuine price discovery.
Reading the $0.14 Signal
Forget the noise. This level is a major confluence zone on higher timeframes. A hold here suggests the underlying uptrend remains intact, with the squeeze merely shaking out weak hands. A break below, however, and the narrative shifts. Traders are watching order book depth and perpetual swap funding like hawks—the next move hinges on whether calm accumulation or renewed fear takes the driver's seat.
The path forward looks clearer without all that leveraged clutter clogging the pipes. One cynical take? The 'smart money' probably triggered the squeeze, scooped up cheap tokens from forced sellers, and is now waiting for retail to FOMO back in—standard finance, just on a blockchain.

The broader structure shows fading intraday momentum as derivatives activity cools and spot markets revert toward earlier ranges.
SEI Slips to $0.132–$0.14 Zone as Open Interest Declines After Liquidity Squeeze
SEI/USD on the 1-hour chart shows a strong V-shaped recovery from 0.118 to above 0.142, driven by a sharp intraday squeeze.
After the peak, the price gradually shifted lower toward the 0.132 area, signaling that the aggressive upside MOVE has weakened.
The chart now shows lower highs and lower lows, reflecting short-term bearish control as the market unwinds the liquidity spike.
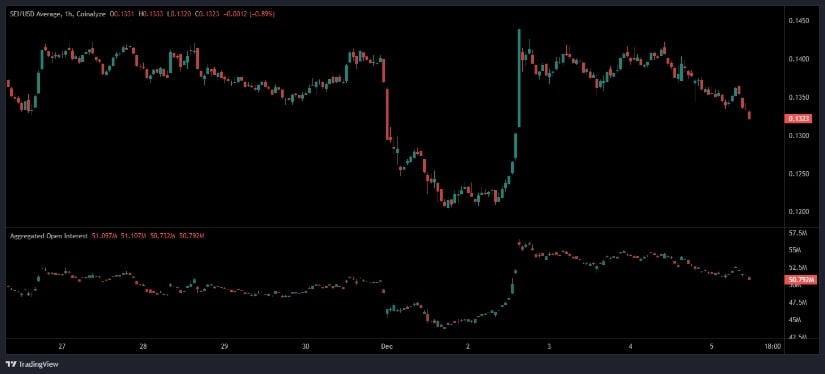
Source: Open Interest
Aggregated open interest (OI) dropped sharply during the initial sell-off but expanded rapidly during the vertical rebound, indicating a surge of Leveraged positioning as the price accelerated upward. Since that point, OI has been drifting lower while price softens, suggesting that earlier positions are being closed or stopped out rather than new commitments forming.
This simultaneous decline in price and OI typically aligns with a cooling market environment where traders reduce exposure following a volatility-driven event.
With no new OI expansion accompanying the pullback, conditions currently favor stabilization over high-momentum continuation moves, and market behavior is centered around whether the prior sell-off lows can remain intact.
SEI at $0.14 with Market Cap at $863.40M and Volume at $64.37M
According to BraveNewCoin data shows the coin is trading at $0.14, down 3.27% over the past 24 hours. The asset’s range has remained tight, with a low of $0.14 and a high of $0.14, reflecting low volatility compared to the previous session’s intraday swings.
The token currently holds a market capitalization of $863.40M, supported by an available supply of 6.37B tokens. Daily trading volume stands at $64.37M, consistent with a moderate liquidity phase following the earlier volatility spike.
The asset remains 88.07% below its all-time high of $1.14, recorded on March 16, 2024, placing it within a prolonged corrective structure that has defined much of 2024–2025 price action. Despite stable liquidity and consistent exchange activity, the market continues to operate within a broader downtrend, shaped by lower highs on the higher timeframes.
SEI in Medium-Term Downtrend as Momentum Indicators Remain Neutral
On the other hand, SEI/USDT on the daily chart remains in a clear medium-term downtrend following a peak NEAR 0.39, with price now consolidating around 0.13, just above the prior significant low at 0.068.
Recent candles show narrow bodies and tight ranges, indicating consolidation rather than a decisive shift in trend.
The overall structure continues to FORM lower highs and lower lows, confirming a sustained downward bias.
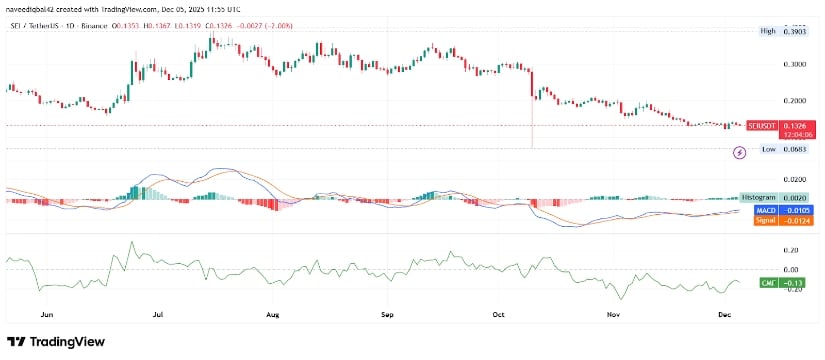
Source: TradingView
The MACD line sits slightly below the signal line, with both positioned near the zero level. This reflects weak bearish momentum and a lack of trend strength on either side. The histogram has turned slightly positive, showing an early attempt at upward momentum, though the signal remains fragile without a confirmed crossover or strong volume support.
Chaikin Money FLOW (CMF) remains negative, showing that capital outflows continue even as price moves sideways. This combination of negative money flow, neutral momentum, and a broader downtrend aligns with a cautious technical backdrop, with the market still lacking the structural signals and volume strength typically associated with a sustainable shift in trend.
