Arbitrum (ARB) Price Prediction: Intraday Breakers Flash Bullish Signal as ARB Targets $0.30

Arbitrum's ARB token isn't just holding the line—it's gearing up for a run. Intraday momentum is breaking out, flashing the kind of technical strength that gets traders' attention. The target? A decisive push toward the $0.30 mark.
The Technical Setup
Forget vague optimism. The charts are telling a clear story. Key intraday resistance levels have been shattered, acting more like springboards than ceilings. This isn't passive growth; it's active, aggressive buying pressure cutting through previous sell zones. Each breaker confirms the bulls are in control, bypassing weak hands and setting a new floor for the rally.
Eyes on the Prize: $0.30
The $0.30 level isn't just a random number. It represents a critical psychological and technical threshold—a gateway to higher valuations if ARB can claim it and hold. The current trajectory suggests the market is aligning for that exact test. Volume confirms the move, lending credibility that this is more than a fleeting pump.
Of course, in a sector where 'fundamentals' can mean a meme and a dream, a cynical observer might note that today's technical breakout is tomorrow's 'what went wrong?' post if sentiment flips. But for now, the momentum is undeniable. ARB is charging, and $0.30 is squarely in its sights.

ARB is entering a critical phase after months of persistent downside pressure, with the token trading NEAR $0.22 as of early December. While still down over 90% from its 2024 peak, recent structural shifts across revenue data, long-term trendlines, and intraday breaker reactions are prompting analysts to re-evaluate the risk-reward profile.
ARB’s broader trend remains bearish on higher timeframes, but the latest combination of on-chain strength, ecosystem revenue growth, and technical inflection zones suggests the possibility of a medium-term stabilization if buyers continue defending the current region.
Ecosystem Revenue Shows Resilience Despite Market Weakness
Fresh ecosystem data shared by Rand highlighted that ArbitrumDAO generated a year-to-date revenue high of $4.5M in October, driven by growth in transaction fees, Treasury contributions, and increased activity across Orbit chains.
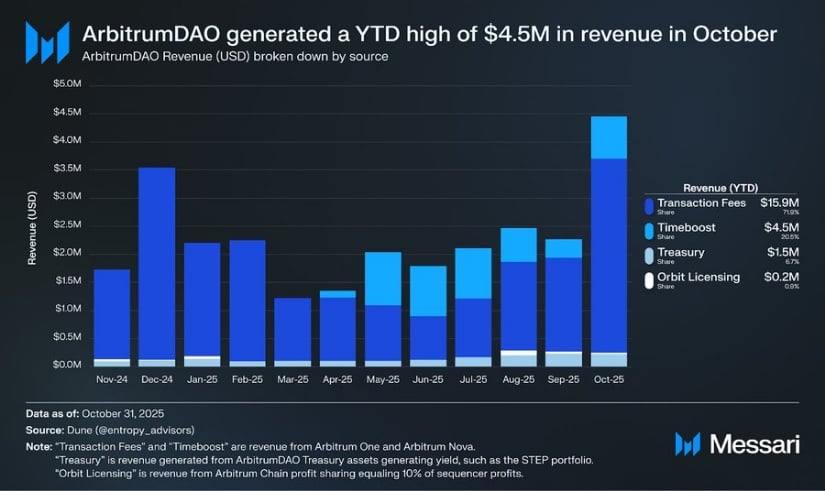
ArbitrumDAO’s revenue hit a yearly peak of $4.5M in October, highlighting strong ecosystem activity despite ARB’s prolonged price decline. Source: Rand via X
This revenue trend contrasts sharply with ARB’s declining price, indicating that network fundamentals have not deteriorated at the same pace as token valuation. Analysts note that such divergences often appear during late-stage corrections, though they do not guarantee immediate reversals.
Still, the combination of real revenue growth, expanding RWA use cases, and steady L2 adoption helps FORM a more constructive backdrop as ARB tests historical support zones.
ARB Technical Structure
ARB has spent nearly two years inside a broad descending channel, with each rejection creating lower highs and pushing price back towards long-term trendline support. Bitcoin Meraklisi’s chart shows price once again reacting from the lower boundary, the same region that produced strong counter-trend rallies in 2023 and 2024.
This channel support between $0.17 and $0.19 overlaps with historical demand zones and multi-year liquidity shelves, making it one of the most critical structural regions for ARB.
If the channel base continues to hold, the analyst notes that mean-reversion targets towards $0.26, $0.30, and $0.35 may become achievable, especially if broader market conditions stabilize into Q1 2026.
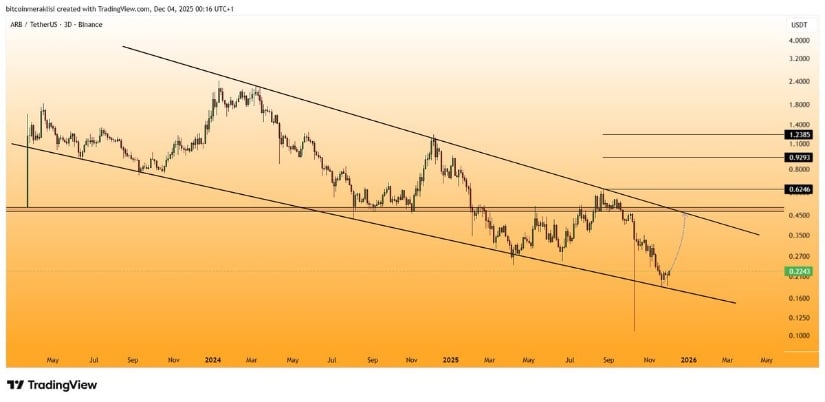
ARB continues to react from the lower boundary of its multi-year descending channel, a zone that previously launched strong counter-trend rallies. Source: bitcoin Meraklisi via X
Intraday Breaker Zones Signal First Signs of Strength
GhostMMXM pointed to a recent breaker retest on the 1H chart where ARB reclaimed a prior breakdown region, flipped it into support, and began building a higher-low formation. These kinds of intraday breaker structures often indicate early re-accumulation, especially within larger corrective cycles.
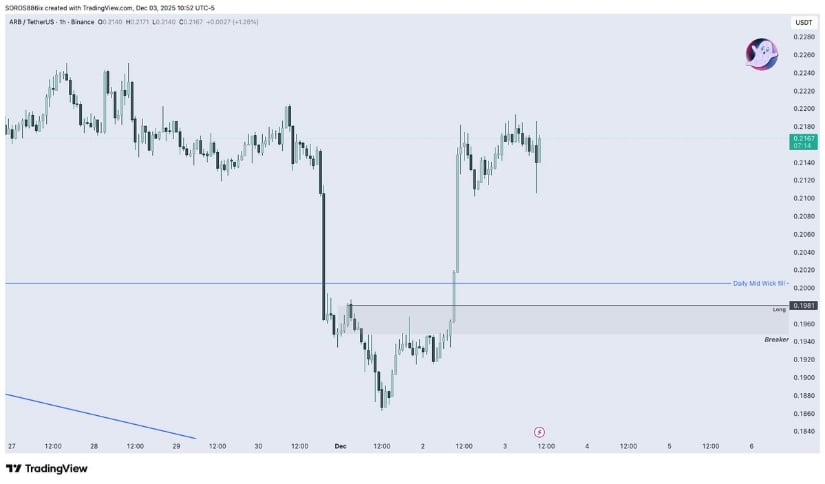
ARB reclaimed a key intraday breaker on the 1H chart, flipping it into support and hinting at early re-accumulation. Source: GhostMMXM via X
Smcapitalclub added that ARB’s “next magnet zone” sits higher around $0.28–$0.30, aligning with inefficiencies left by November’s sell-off. Breakers and magnets alone do not define trend reversals, but they serve as important short-term signposts when paired with improving structure.

ARB’s next “magnet zone” sits at $0.28–$0.30, aligning with key inefficiencies from November’s decline. Source: Smcapitalclub via X
Arb Arbitrum Price Longer Term View
Bitcoin Meraklisi emphasized that ARB’s current price range mirrors the conditions found during DEEP accumulation phases in other L2 cycles. Price sits within a multi-year low region, which historically attracted long-term buyers.
If ARB can maintain support and produce a higher timeframe swing low, analysts believe the first medium-term upside region sits around $0.62–$0.80, representing the midpoint of the descending channel and overlapping with past distribution levels.
However, such moves historically require either:
-
A shift in crypto-market liquidity
-
A broader altcoin rotation
-
Or a structural reclaim of mid-channel resistance
Until then, confidence remains dependent on how ARB behaves at the base of the current channel.
ARB Price Prediction: Outlook and Scenarios
Arbitrum’s price outlook remains tied to whether the long-term descending channel base continues to hold. If buyers defend the $0.18 to $0.20 region and convert the recent higher-low structure into a broader shift in momentum, ARB could begin working its way towards the mid-range zones at $0.26 to $0.30. These levels have repeatedly acted as reaction points and also align with inefficiencies left behind during the sharp November decline.
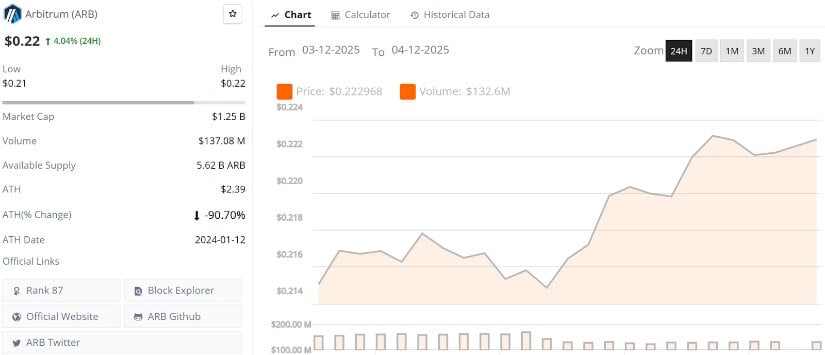
Arbitrum’s current price is $0.22, up 4.04% in the last 24 hours. Source: Brave New Coin
A firm reclaim of $0.30 WOULD be the first strong indication that ARB is attempting a deeper recovery, opening the door towards the channel midpoint near $0.35 and potentially extending into the higher structural regions around $0.62 to $0.80.
However, if ARB fails to hold the current trendline support, the bearish case remains straightforward: price could slide back into the $0.18 to $0.17 pocket, with extended downside risk towards $0.14–$0.12 if broader market conditions deteriorate.
Final Thoughts
Arbitrum remains structurally weak on higher timeframes, but the combination of improving revenue, strong ecosystem activity, breaker-based intraday strength, and long-term channel support suggests the possibility of price stabilization.
ARB does not yet show a confirmed trend reversal, but early signals are forming, and the current region has historically generated strong medium-term rallies.
A decisive reclaim of $0.30 remains the key level to watch. Above this, a path towards $0.35, $0.62, and even $0.80 becomes more realistic.
