Optimism Price Dips as Open Interest Plummets - Is the Momentum Gone?

Optimism's price action hits a speed bump. The Layer-2 token is moving lower, tracking a sharp drop in open interest across derivatives markets. Traders are pulling back, and the bullish momentum that fueled recent gains is fading fast.
Where's the Leverage?
Open interest acts as the fuel for price rallies—it's the total value of outstanding derivative contracts. When it drops, it signals traders are closing positions and taking risk off the table. That's exactly what's happening now. The market is de-leveraging, stripping away the speculative froth that can amplify moves in both directions.
A Technical Cooldown
This isn't necessarily a catastrophe. After a strong run, a cooldown in futures activity can create a healthier foundation. It shakes out weak hands and over-leveraged positions, potentially setting the stage for a more sustainable move later. But for now, the immediate pressure is to the downside as buying interest wanes.
The Bigger Picture for L2s
The move highlights a constant tension in crypto trading: the divide between long-term protocol utility and short-term market speculation. Optimism's core tech—faster, cheaper Ethereum transactions—hasn't changed. But in the markets, sometimes the most innovative tech takes a backseat to the oldest story in finance: fear, greed, and the relentless hunt for the next quick flip.
Watch for a shift. If open interest stabilizes and price finds support, this could be a classic bull-market breather. If not, get ready for more turbulence. After all, in crypto, the only thing faster than a blockchain is a change in sentiment.

Market conditions show weakening leverage participation, reduced buyer commitment, and compressed intraday volatility — all reinforcing a bearish short-term outlook for the token.
Open Interest Confirms Leverage Flush as OP Extends Breakdown
On the 1-hour chart, OP continues to trade in a subdued range after the sharp breakdown that sent price from the $0.31–$0.33 region into the mid-$0.28s. The selloff left a large displacement candle, signalling forced liquidations and aggressive unwinds rather than gradual, organic selling pressure. Since then, the chart has shown only shallow rebounds, with each attempt to push higher fading quickly.
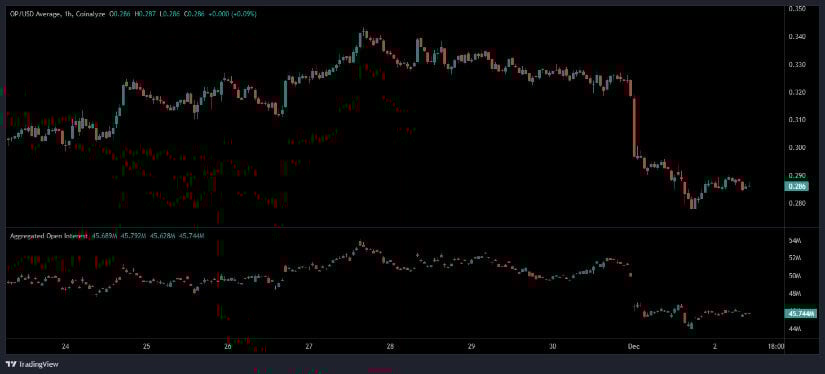
Source: Open Interest
Aggregated open interest now sits near 45.74M, well below the levels seen before the correction. The decline in OI reflects a clear reduction in Leveraged exposure, indicating that both longs and shorts unwound positions as volatility spiked. The stabilisation of OI in a narrow band over the past several hours shows a wait-and-see stance from market participants, with neither side willing to commit meaningful size.
For the asset to regain short-term momentum, price WOULD need to reclaim the $0.30–$0.31 zone — an area that acted as support before the breakdown — alongside a measurable increase in OI. Without renewed participation, the current structure leaves room for further drift toward lower support.
Data Shows OP Down 2.80% as Market Cap Falls to $542M
BraveNewCoin data shows the token trading at $0.29, down 2.80% over the last 24 hours, with a market cap of $542.96M. Volume sits NEAR $68.12M, consistent with the muted activity seen across the broader layer-2 sector in recent sessions. The token has been steadily losing ground since its early-year highs, breaking below several key bands of support as weaker liquidity and trailing sentiment weigh on price performance.
The continuation of lower highs suggests a lack of sustained demand, while the inability to hold above the $0.30 threshold reinforces the market’s defensive posture. As long as the crypto remains below this area, the broader trend maintains its bearish tone with no immediate signs of reversal.
Indicators Show Persistent Weakness as Selling Pressure Dominates
On the daily chart, OP trades near $0.2865, marginally down 0.28% as it extends its multi-week decline from the $0.55–$0.60 region. The structure remains clearly bearish, with each rally meeting sellers sooner than the last and daily candle ranges tightening as volatility compresses.

Source: TradingView
The MACD remains negative at -0.0307, hovering just above the signal line at -0.0304. The nearly flat histogram suggests downside momentum is easing but not yet reversing, leaving the coin vulnerable to further selling pressure if buyers fail to step in. With Chaikin Money FLOW (CMF) holding around -0.17, capital flows continue to signal net outflows, confirming the broader lack of accumulation.
A meaningful shift would require the token to reclaim the $0.33–$0.35 zone and secure a CMF recovery toward zero, ideally accompanied by a bullish MACD crossover. Until those signals develop, the chart structure supports continued consolidation with a bearish tilt and a potential test of the $0.20–$0.22 support region.
