Sei Price Prediction 2030: Can SEI Rebound After Recent Slide?

SEI stumbles as broader crypto momentum falters—what's next for the high-speed chain?
The once-buzzing asset finds itself in a familiar crypto purgatory: caught between its technological promise and the market's fickle appetite.
Beyond the Short-Term Noise
Forget the daily chart squiggles. The real question isn't about this week's dip, but where the project lands by the end of the decade. Its core pitch—blazing transaction speeds for trading applications—remains compelling in a sector still plagued by congestion and high fees.
The 2030 Calculus
Projections hinge on adoption, not hype. If Sei's infrastructure becomes the de facto backbone for a new wave of decentralized exchanges and trading dApps, the valuation thesis changes entirely. If it doesn't, it joins the graveyard of 'vaporware with a whitepaper.' The team's execution over the next few years is the only metric that matters.
A Reality Check
Let's be frank: for every genuine innovation in crypto, there are a dozen projects riding the coattails of a catchy narrative. Sei's tech needs to prove itself in the brutal, real-world arena of mainnet activity and developer migration—not just on testnet benchmarks and conference slides.
The path to 2030 is paved with code, not speculation. The market's current weakness is a stress test. Time to see if the foundation is concrete or sand.

Open interest data shows fading derivatives participation, while broader market metrics reveal cooling momentum as the asset struggles to recover from multi-week lows.
Price Softens as Open Interest Drops After Sharp Sell-Off
The 1-hour SEI/USDT chart shows a decisive shift in sentiment after the price fell aggressively from the $0.14 region, extending a multi-session downtrend. The steep decline on the right side of the chart pushed the coin toward the $0.126–$0.128 zone, where a temporary stabilization formed. Although a small rebound has emerged, the broader structure remains bearish, defined by persistent lower highs and lower lows across the week.

Source: Open Interest
Aggregated open interest underscores this weakening momentum. OI held near the 47M range before the breakdown but contracted immediately as the selling intensified. The decline reflects a clear reduction in Leveraged exposure, signaling that participants are closing positions rather than initiating new ones.
This behavior typically accompanies risk-off conditions and reinforces the cautious tone surrounding the current sei price prediction outlook. With open interest recovering only marginally after the drop, speculative demand remains subdued, suggesting limited conviction among short-term buyers.
Faces Pressure as Data Shows Cooling Demand
Broader market data from BraveNewCoin confirms the softening backdrop. The coin trades at $0.14, showing a 1.28% gain in the past 24 hours, yet still sitting well below recent weekly levels.
Market capitalization stands at $875.07M, while trading volume has reached $46.08M, indicating moderately active repositioning among holders. Despite the short-term uptick, the coin remains locked within a corrective structure that has shaped its price action throughout recent sessions.
The available supply of 6.37B tokens places the token at Rank 110 globally. Intraday movements reflect repeated struggles to hold above the $0.135–$0.14 zone, which has shifted from support to resistance following consecutive sell-offs.
Weakens Further as TradingView Indicators Turn Bearish
On the daily timeframe, the asset trades at $0.1284 at the time of writing, marking a 6.35% decline and extending its broader downward trajectory.
The chart highlights an ongoing bearish trend reinforced by repeated failures to overcome resistance between $0.18 and $0.22. Each rebound attempt has been short-lived, with aggressive selling re-entering the market and pushing the token back toward local lows.
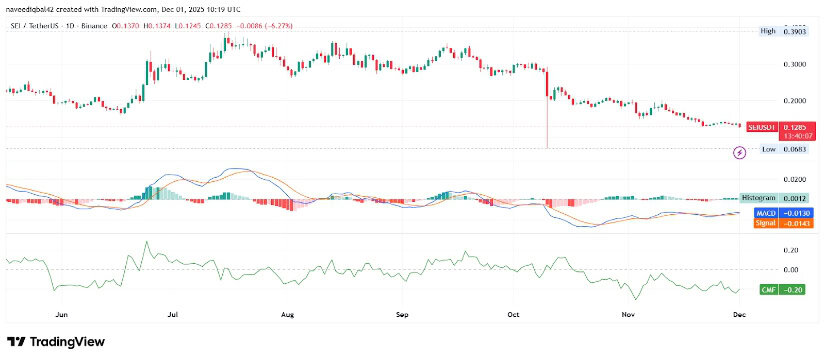
Source: TradingView
Momentum indicators align with this weakness. The MACD sits at −0.0131 against a signal line of −0.0143, while the histogram remains only slightly positive at 0.0012—insufficient to suggest a meaningful shift in direction.
The Chaikin Money Flow remains firmly negative at −0.20, reflecting persistent outflows and limited accumulation. These readings illustrate the dominant pressure on the coin, shaping a cautious SEI price prediction landscape as the asset struggles to attract sustained buy-side engagement.
