Bitcoin’s $86K Defense: Will Trendline Resistance Fall as Bulls Target $93K Breakout?

Bitcoin's price action is testing a critical line in the digital sand. The $86,000 level has become the latest battleground, with bulls scrambling to hold support against a stubborn trendline resistance that's capping upside momentum.
The Resistance Wall
That overhead trendline isn't just a line on a chart—it's a psychological barrier that's kept rallies in check. Each test reinforces its significance, turning it into a self-fulfilling prophecy of rejection. Breaking it requires more than just buying pressure; it needs a narrative shift strong enough to convince the market that old ceilings are now new floors.
The $93K Horizon
Beyond the immediate struggle lies the real prize: a clean breakout toward $93,000. That target isn't arbitrary; it represents the next major liquidity zone and a potential launchpad for a fresh leg higher. Traders are watching for any decisive close above resistance as the signal to shift from defense to all-out offense.
Market sentiment hangs in the balance, caught between institutional accumulation whispers and the ever-present fear of a sharp correction. The current consolidation feels like the calm before a storm—the only question is which direction the winds will blow. One thing's certain: in crypto, the most expensive lesson is often learning that traditional support and resistance levels move twice as fast when fueled by leverage and hope. A cynical observer might note this is just another day where price predictions matter more than actual utility—but try telling that to a portfolio flashing green.

With recent volatility following October’s near-$100K highs, market watchers are weighing whether BTC can maintain momentum in the coming weeks.
According to TradingView chart data, the Relative Strength Index (RSI), a momentum indicator, is approaching oversold levels NEAR 16 on the 60-minute timeframe, which may suggest short-term buying pressure if support levels hold.
Key Technical Levels Under the Spotlight
Analysts highlight several critical thresholds for Bitcoin’s short-term price action. crypto strategist Heisenberg, known for macro-trend analysis on TradingView, commented:
“BTC bulls may need to break above $93K to sustain upward momentum. Support around $86K is important, and defending $80K could prevent a deeper correction scenario.”

BTC bulls face $93K trendline resistance, with $86K and $80K key supports amid a recent 6% drop and ongoing volatility. Source: Heisenberg via X
The $93K level coincides with a descending trendline on the daily chart, which has recently acted as resistance, according to chart data from TradingView. Short-term support near $86K is considered significant by many traders, while failure to hold this level could increase the risk of a correction toward the $80K zone. Historical price data from BraveNewCoin shows BTC experienced a 5% year-to-date decline by late November, despite hitting all-time highs in October.
Mixed Signals in the Market
Market data indicate continued volatility amid weak ETF inflows. According to major ETF monitoring platforms, inflows have remained modest, contributing to uncertainty. Trader @follis, who frequently shares intraday setups on X, observed that BTC recently moved from $90,379 down to $87,044 within a session:
“If Bitcoin fails to maintain key support levels, downside targets below $85K may become more likely,” the trader noted.
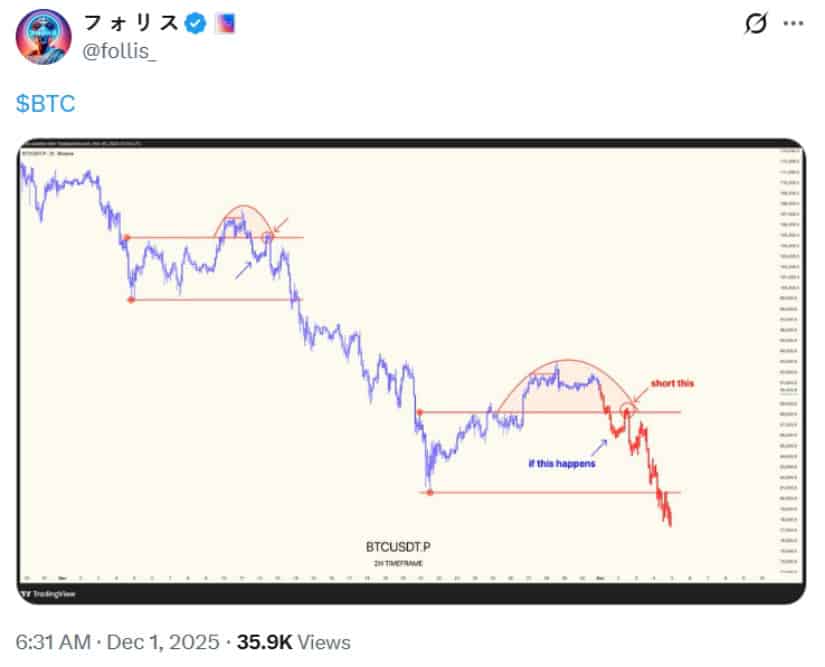
BTCUSDT short setup emerges below 92K, signaling potential further declines amid trader panic and market pressures. Source: @follis via X
This mixed technical picture reflects broader market sentiment following a challenging November. Analysts expect BTC could continue to experience sideways or volatile movements within the $80K–$92.5K range in early December.
Bullish Outlook Still in Play
Despite short-term pressures, some observers maintain a cautiously bullish perspective. A technical analyst monitoring Bitcoin’s Ichimoku cloud structure explained:
“As long as BTC remains above the green trendline and the weekly Ichimoku cloud—a tool often used to identify long-term support—upward momentum could remain intact. Breaking below these areas may indicate a potential shift in trend.”
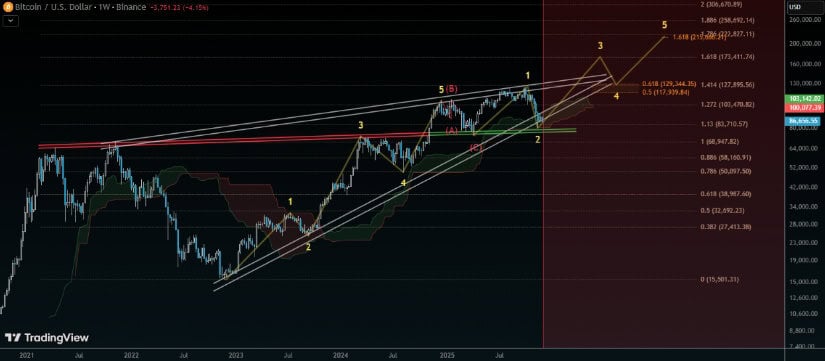
BTC remains bullish while holding above the green trendline and weekly Ichimoku cloud; a break below these levels could signal a trend shift. Source: SovereignCharts on TradingView
Chart data from TradingView supports this view, showing that BTC has repeatedly bounced off these support zones in prior weeks.
Short-Term Resistance Challenges
Bitcoin faces resistance near the descending trendline, with price action suggesting sellers may be dominating near higher levels. Breaking above $93K could signal bullish continuation, depending on market conditions, while failure to sustain support at $86K might accelerate downward pressure.
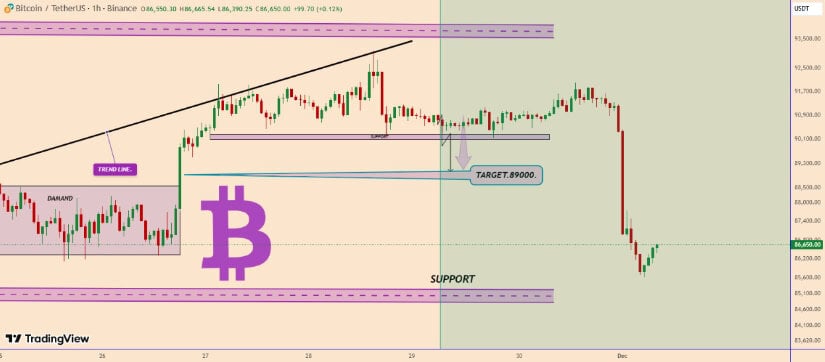
Bitcoin is facing trendline resistance and has broken support, suggesting bearish momentum toward the $89,000 zone. Source: Stevenexpert540 on TradingView
Analysts are also watching potential rebound zones around $89K, noting that consolidation and minor pullbacks could define BTC’s trajectory in the short term.
Final Thoughts
Bitcoin is at a critical juncture. While bullish sentiment persists, BTC must overcome resistance near $93K and maintain support around $86K to sustain momentum. Failure to defend these levels could result in a correction toward $80K or lower.
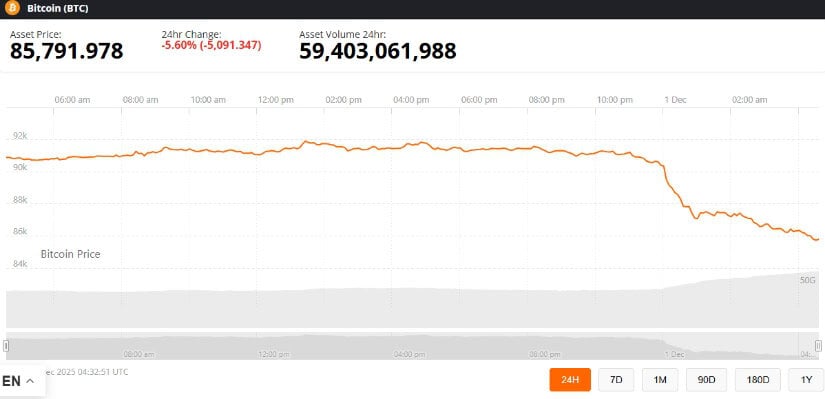
Bitcoin was trading at around 85,791.97, down 5.60% in the last 24 hours at press time. Source: Bitcoin price via Brave New Coin
Investors and traders are advised to monitor technical indicators and support/resistance levels closely, as these metrics provide insight into short-term price behavior. The next few weeks may prove decisive for BTC as it heads into 2026.
