SOLANA REBOUND ALERT: $133 Support Holds Firm as Multi-Timeframe Signals Point to $150-$165 Breakout

Solana bulls dig in at critical support level while technical indicators flash green across multiple timeframes.
The $133 Battle Line
SOL refuses to surrender the $133 zone—traders watching this level like hawks as it becomes the make-or-break point for November's momentum. Every dip gets bought, every sell-off meets instant resistance.
Technical Alignment Sparks Optimism
Charts don't lie: weekly, daily, and 4-hour setups all converge toward one conclusion. The stars align for a potential run toward that sweet $150-$165 range where previous resistance awaits.
Market Psychology at Play
Traders pile into positions betting on the Santa rally coming early—because nothing says holiday spirit like double-digit percentage gains while traditional finance types fight over bond yields that barely beat inflation.

Price is attempting to base after a sharp multi-week pullback, and with volatility compressing across multiple timeframes, traders are closely watching for the next decisive move.
This steady consolidation comes at a moment when solana is once again attracting institutional demand, on-chain network performance remains strong, and several technical structures hint at a potential trend reversal.
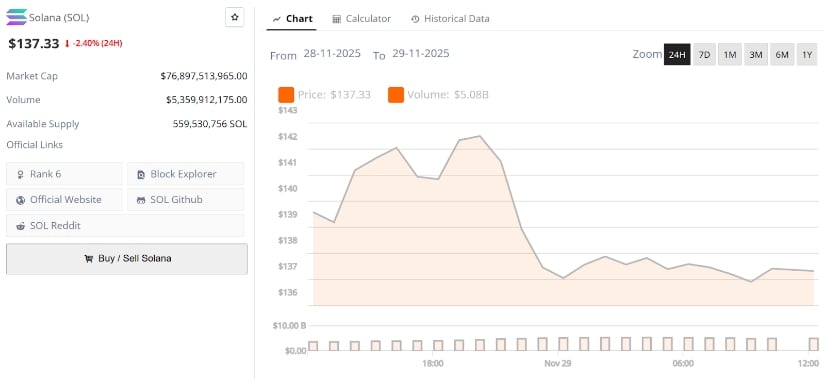
Solana current price is $137.33, down 2.40% in the last 24 hours. Source: Brave New Coin
Institutional Demand Re-Emerges as ETF Inflows Strengthen
Institutional appetite remains one of Solana’s strongest tailwinds. According to data highlighted by Ted Pillows, the Bitwise Solana ETF accumulated $13,150,000 in SOL in a single day, adding to months of persistent inflows.
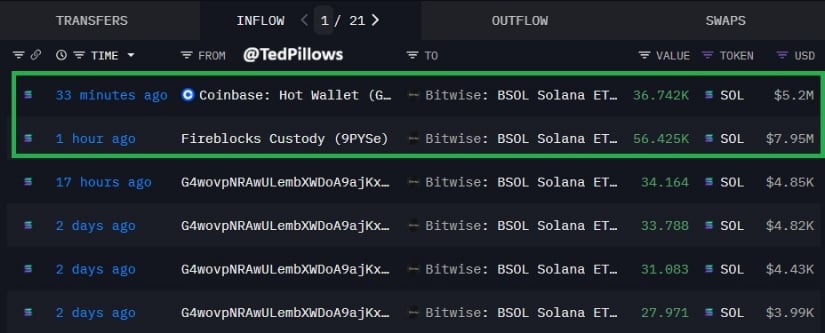
This steady activity is significant because ETF demand often absorbs sell-side pressure during market corrections. Ted’s tracking of ETF wallets shows a series of large transfers funneling directly into long-term custody addresses, exactly the type of accumulation structure typically seen before medium-term recoveries.
Combined with earlier reports that over $527M flowed into Solana ETFs since mid-November, institutional interest continues to FORM a supportive backbone beneath current price levels.
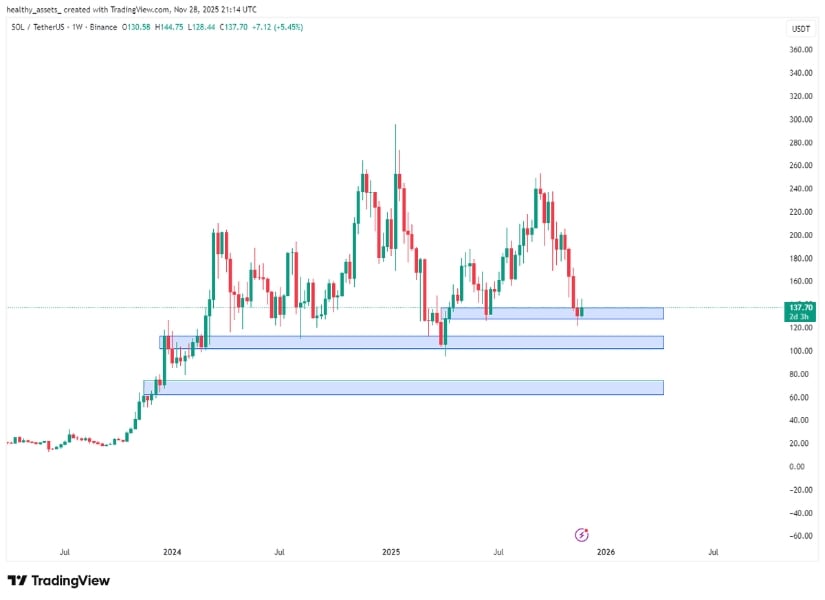
High-Timeframe Demand Zones Strengthen the Case for a Reversal
A key factor supporting bullish sentiment comes from the higher-timeframe technical structure. Drew shared a weekly Solana chart showing price reacting cleanly off major demand zones between $118–$133, areas that have historically acted as macro basing regions during multi-month consolidations.
The weekly Solana price shows a pattern of higher-timeframe support retests similar to earlier bullish cycles, suggesting that SOL may be preparing to stabilize before attempting a recovery towards the $200 region, whether by January or in early Q1, depending on volume follow-through.
Technical Outlook: Solana Price Sustaining $133 Support Zone
Across the mid-timeframes, Solana appears to be coiling into a tighter structure. CryptoPulse described the 1-hour and 4-hour setups as “textbook,” noting that SOL is interacting with a key support zone at $133, which has repeatedly acted as an intraday pivot.
The chart shows a sequence of tightening highs and higher swing lows, a formation that often precedes an expansion move. If buyers can hold above $133, the next logical upside reaction WOULD be towards $144, followed by the more significant liquidity zone at $152–$153.
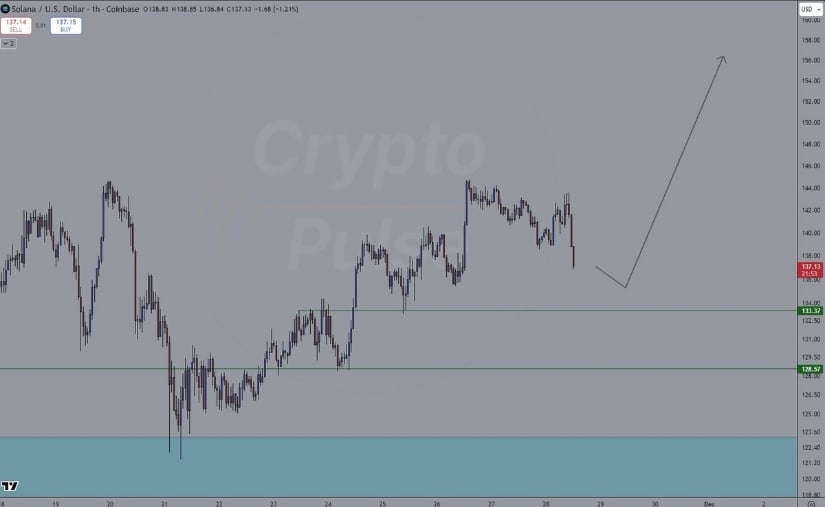
Liquidity behavior supports this view, with multiple market watchers flagging the $144 level as a near-term breakout trigger.
SOL Deviation Offers a Possible Long Opportunity
Another important structural read comes from CryptoUB, who highlighted the ongoing range behavior on SOL. His chart shows Solana trading NEAR the range low, where previous deviations have led to strong bounce-reversal setups.
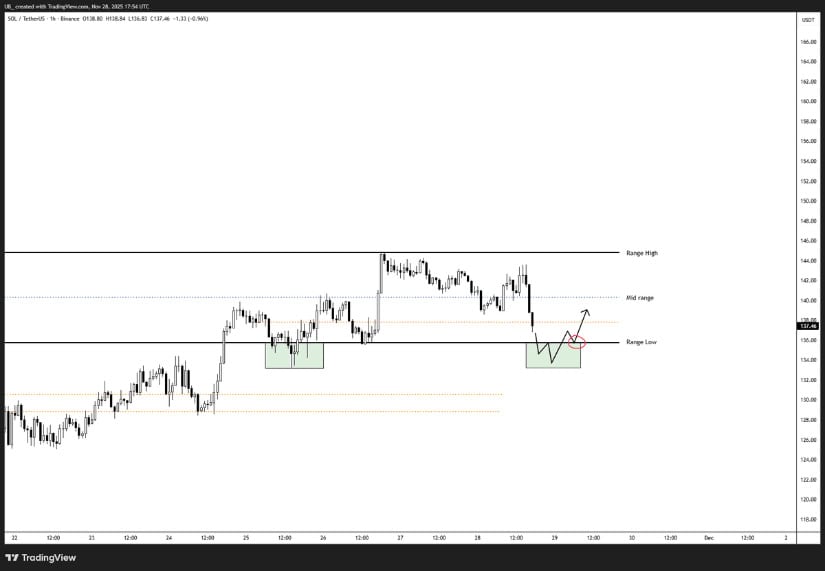
UB pointed out that a clean deviation beneath the range low, followed by a reclaim, could present a fresh long opportunity. The mid-range sits near $146, marking the first major reclaim target before momentum can extend towards the higher range near $160.
Network Strength Reaches Historic Levels
Solana’s on-chain performance continues to impress. SolanaFloor reported that Solana has now achieved 662 consecutive days without a network outage, breaking all previous records and marking the longest uninterrupted runtime in the network’s history.
This matters for price because long-term investors and institutions heavily weigh reliability metrics. The extended period of stability, combined with ongoing upgrades to firing-throughput and fee markets, reinforces Solana’s position as one of the most operationally robust blockchains in the industry. This deeper narrative of network reliability acts as a fundamental tailwind supporting future price recovery potential.
Final Thoughts
Solana’s chart is now clustered around a set of important technical zones that will guide its next major move. These are the levels traders are focusing on:
- Major HTF support: $118–$133
- First breakout zone: $144
- Secondary resistance: $152–$153
- Mid-term expansion target: $165
As long as solana price holds above the $133 support, the market will look to $144 as the first major inflection point and $152–$153 as the zone where momentum must prove itself. A rejection at these levels would keep the market inside a broader consolidation, but a successful breakout could set the stage for a more meaningful recovery into early 2026.
