Stellar (XLM) Tests Critical Support: Will Bulls Defend or Capitulate?

Stellar's price action hits turbulence as bears push toward key demand zones.
Subheading: The Battle for Support
XLM wobbles near make-or-break levels—a breakdown here could trigger algorithmic sell-offs. Meanwhile, traders watch order books like hawks, knowing one whale's panic dump could turn minor support into a freefall.
Subheading: Market Psychology at Play
Every retest weakens the floor. Market makers love this dance—liquidity grabs dressed up as 'healthy corrections.' Meanwhile, retail bagholders pray their dollar-cost averaging will outlast the pain.
Closing Punch: In crypto, 'support' is just resistance waiting to happen. And remember—if technicals fail, you can always fall back on hopium and Twitter hype.

While volatility remains restrained, momentum indicators continue to lean negative, reflecting a market environment dominated by caution rather than aggressive repositioning. Current trading behavior suggests consolidation under pressure, with price interacting closely with short-term support.
Bearish Signals Intensify as Price Tests Key Support at 0.255
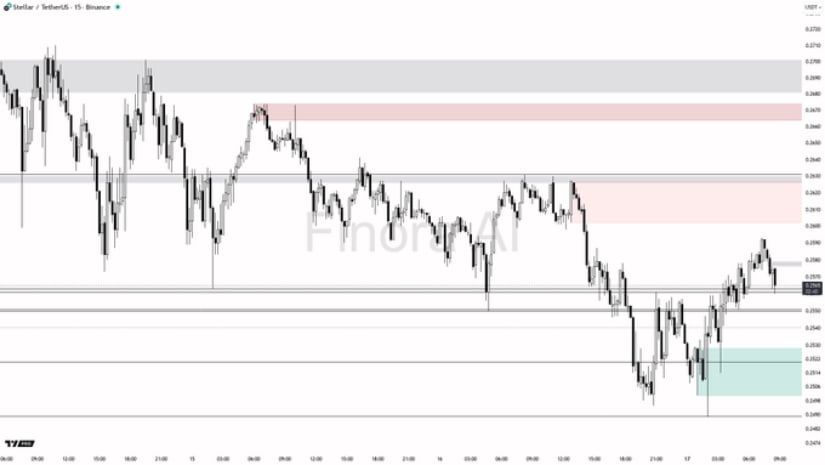
An update from Finora on X highlights that XLM is navigating “bearish currents” on the 15-minute chart, with price currently testing a minor support around $0.255. The analysis notes clear bearish momentum, with the overall trend showing no active signs of reversal at this stage.
Source: X
Finora identifies multiple bearish indicators aligning simultaneously, increasing the likelihood of follow-through if the price breaks decisively below $0.255. Such a move WOULD confirm downside momentum and potentially open a path toward the stronger demand zone at $0.249–$0.251, which has historically served as a stabilization area.
To the upside, near-term resistance sits at $0.258, followed by a more significant barrier NEAR $0.263. A firm close above these levels could temporarily shift bias, though current conditions favor caution. The analyst notes this is a trimmed version of the full analysis, which includes detailed trade parameters.
Lower as 24-Hour Performance Reflects Controlled Pressure
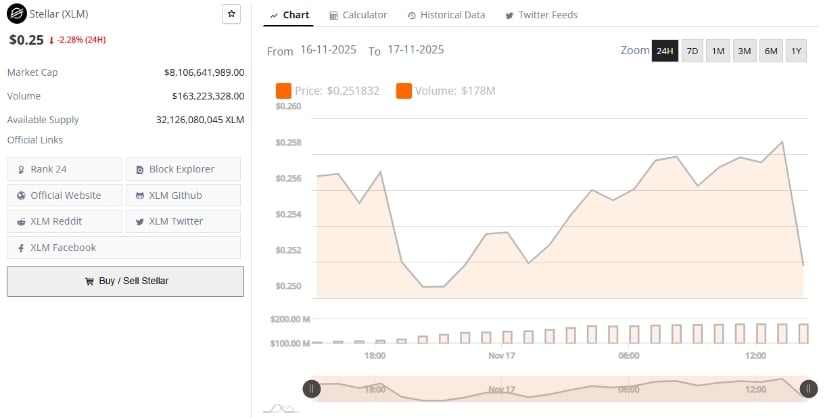
Market data from BraveNewCoin lists XLM trading near $0.25, marking a –2.28% decline over the past 24 hours. Stellar’s market capitalization stands at $8,106,641,989, supported by $163,223,328 in trading volume. Circulating supply is recorded at 32,126,080,045 tokens, placing the asset at Rank 24 globally by market cap.
Source: BraveNewCoin
Intraday price action has ranged between $0.246 and $0.252, reflecting controlled movement with neither pronounced selling pressure nor notable accumulation. The volume structure remains stable, aligning with a consolidation environment rather than directional expansion. While the broader trend maintains a bearish tilt, liquidity remains sufficient to support orderly price action without disruptive volatility.
Low Volatility and Sustained Bearish Momentum
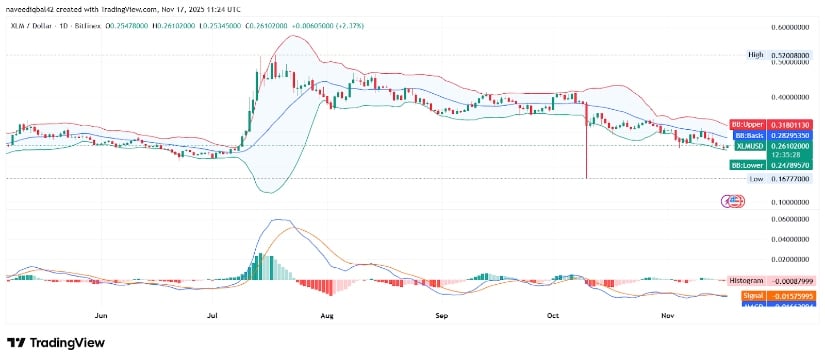
The TradingView XLM/USD chart from TradingView shows price trading near $0.261, positioned below the basis Bollinger Band at $0.282 and between the upper band at $0.318 and the lower band at $0.248. The relatively flat formation of the bands signals low volatility, with the coin holding a narrow range for several weeks.
Source: TradingView
Earlier in the year, a strong upward spike in early July pushed the price toward $0.52, dramatically widening the Bollinger Bands before the market retraced and stabilized. The more recent contraction of the bands indicates consolidation, often preceding a notable directional move, though timing remains uncertain.
Momentum conditions remain soft. The MACD line sits at –0.016, while the signal line is positioned at –0.015, keeping both readings in negative territory. The histogram, at –0.00089, signals slightly bearish momentum with limited divergence. The MACD has largely stayed below the signal line since August, reinforcing a cautious outlook, as upside signals have yet to emerge meaningfully.
