Floki Price Prediction: Is the Pullback Just a Cooldown Before the Next Rally?

Memecoin mania takes a breather as Floki retraces—but don't count the dog out yet.
After a parabolic run, FLOKI's chart shows classic profit-taking behavior. Traders are rotating gains into blue chips while retail FOMO cools. Yet the memecoin's cult-like community hasn't budged—Telegram groups still buzz with diamond-hand rhetoric.
Key levels to watch: The 0.000025 support held twice this week, creating a local double bottom. Break that, and we're looking at a 30% drop to the next psychological zone. Hold it, and we could see another leg up toward November's highs.
Remember: In crypto, 'fundamentals' are just vibes dressed up in Excel sheets. Floki's 'utility' as a payment token remains as theoretical as your average Wall Street analyst's integrity.

Open interest shows a steady decline, reflecting the gradual unwind of Leveraged The latest price recovery appears supported mainly by spot demand rather than futures participationMarket watchers are now looking for signs of renewed conviction that could define the next directional move
Open Interest And Consolidation Outlook
Floki Price Prediction discussions currently center on the recent decline in aggregated open interest (OI) as price movement stabilizes on the lower timeframes. On the 1-hour chart, OI decreased from approximately 3.42 million to 3.41 million, reflecting a gradual unwinding of leveraged positions. This shift occurred while the price was trending lower, suggesting that long positions were being closed as traders adjusted exposure after prior bullish momentum weakened.
Even during a short-lived rebound toward $0.0000066, open interest did not recover. This divergence indicates that the upward price MOVE was driven by spot market activity rather than futures positioning, signaling a cautious trading environment.
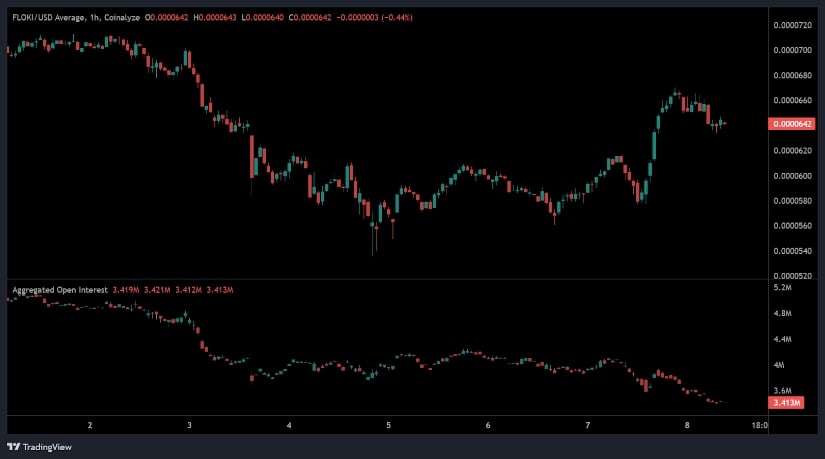
Source: Open Interest
Such behavior is typical during consolidation periods, when speculative participation decreases and markets transition into lower-volatility structures. The coin, the next directional move may depend on whether open interest begins to rise again during any future upward price attempt. A continued decline in OI WOULD imply hesitant sentiment and potential downside continuation.
Market Data Reflects Support Retest Around $0.006445
According to BraveNewCoin data, FLOKI is currently trading near $0.00006445, reflecting a 5.74% increase over the last 24 hours. The token has a market capitalization of approximately $622 million, with a circulating supply of 9.65 trillion tokens and a daily trading volume of around $109 million. The price structure has stabilized in recent sessions after experiencing a broader correction across the meme token segment.
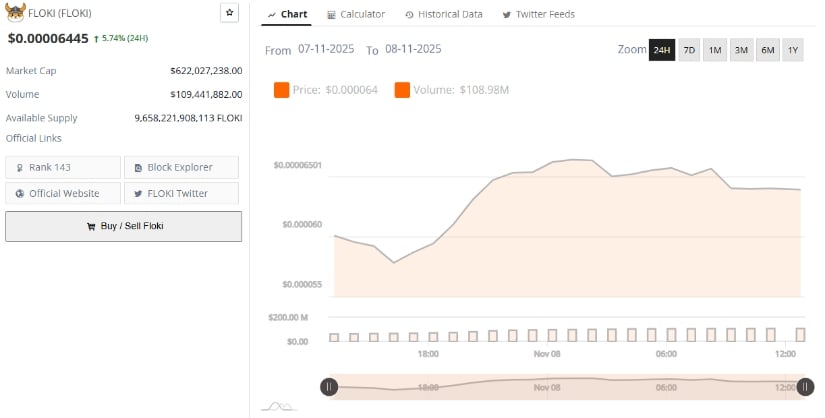
Source: BraveNewCoin
Market performance indicates measured liquidity conditions, with neither strong accumulation nor aggressive distribution dominating the order books. The stabilization suggests participants are assessing whether the recent downward movement has reached a point of support. Within the coin frameworks, this phase of neutral sentiment is significant, as consolidation often precedes either recovery expansion or further corrective pressure, depending on subsequent volume behavior.
Observing price interaction NEAR $0.000062–$0.000066 will be important in assessing whether buyers begin to re-engage. Sustained trading within this range may serve as the base for any gradual recovery attempt.
Market Sentiment and Outlook at a Pivotal Technical Level
A TradingView analysis of the coin’s daily chart highlights the price trading slightly below the 20-day Bollinger Bands baseline at $0.00006899, indicating moderated short-term bearish sentiment. The lower Bollinger Band near $0.0000569 forms immediate support, while the upper band at $0.0000810 represents the next significant resistance level. The narrowing of the Bollinger Bands reflects reduced volatility, a condition that often precedes a directional breakout.
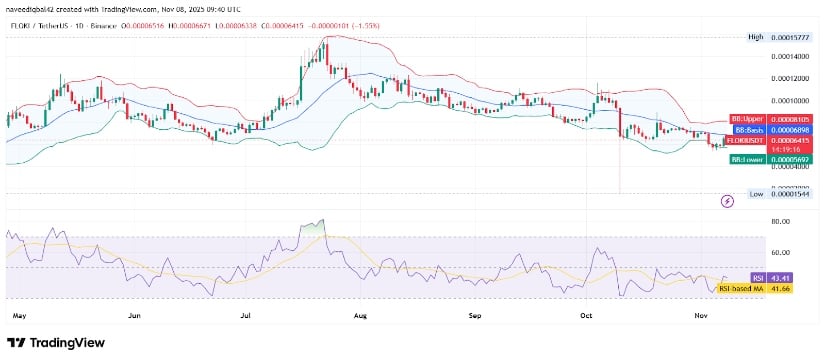
Source: TradingView
The Relative Strength Index (RSI) currently reads 43.58, with its signal line near 41.67, suggesting weakening bearish momentum, though not yet confirming buyer dominance. Should price close above the Bollinger band with increased volume, floki price prediction models would shift toward a short-term bullish recovery outlook. Conversely, failure to defend the lower band could expose price to a retest of the $0.000055 region.
