Chainlink at Make-or-Break Moment: Will Key Support Hold Amid Bearish Channel?

Chainlink's price action just hit a critical inflection point—testing a make-or-break support level while trapped in a descending channel. Bulls and bears are locked in a tug-of-war, with LINK's next move likely setting the tone for weeks to come.
Technical tension mounts as the oracle token flirts with levels that could either trigger a reversal or confirm further downside. Traders are watching the channel's lower boundary like hawk-eyed Wall Street analysts—except with less coffee and more hopium.
Will Chainlink defy the downtrend, or is this another 'buy the dip' trap waiting to liquidate overleveraged degens? The charts don't lie—but they do love drama.

The token has spent several weeks establishing lower highs and lower lows, indicating controlled downward movement rather than a sharp breakdown.
Channel Support in Analyst Setup
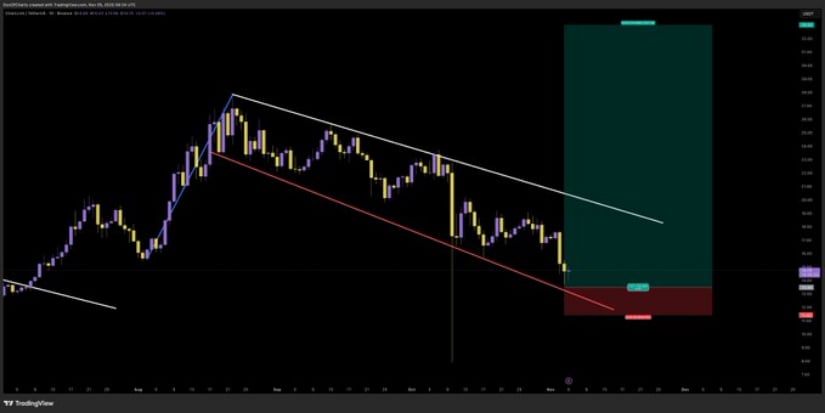
In a recent chart shared on X, market analyst @DonaldsTrades highlighted a descending channel structure governing current LINK/USDT movement. The chart shows price oscillating between two downward-sloping trendlines, with the token now pressing into the lower boundary of the formation.
Source: X
The analyst emphasized that this area represents a potential reversal zone, where bullish participants may attempt to regain control. The trade setup suggests a long entry NEAR current support, targeting a move toward the upper channel boundary, with a favorable risk-to-reward ratio. The stop-loss is positioned below the most recent swing low, while possible take-profit levels extend toward the $20–$22 area, which aligns with previous reaction zones in prior market cycles.
If the asset holds and begins to climb, the structural trendline break WOULD serve as an early technical signal that momentum is shifting upward. For now, the coin thesis rests on whether bulls can defend this channel base.
Market Data and Stabilizing Volumes
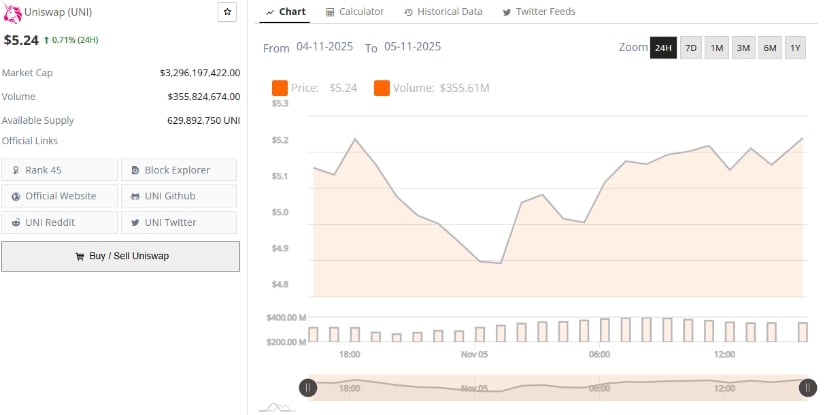
According to BraveNewCoin data, the coin is currently trading near $14.92, reflecting mild intraday fluctuations. The token holds a market capitalization of approximately $8.7 billion, with 24-hour trading volume around $435 million.
Source: BraveNewCoin
Volume trends suggest that participation remains steady, rather than retreating, which is notable given broader market uncertainty. This stability reinforces the importance of the $14–$15 price region as a recurring pivot area for structure-based reactions.
Maintaining price action above this cluster keeps the Chainlink price prediction outlook constructive, especially if liquidity begins shifting back toward leading altcoins.
strengthened by Falling Wedge Breakout
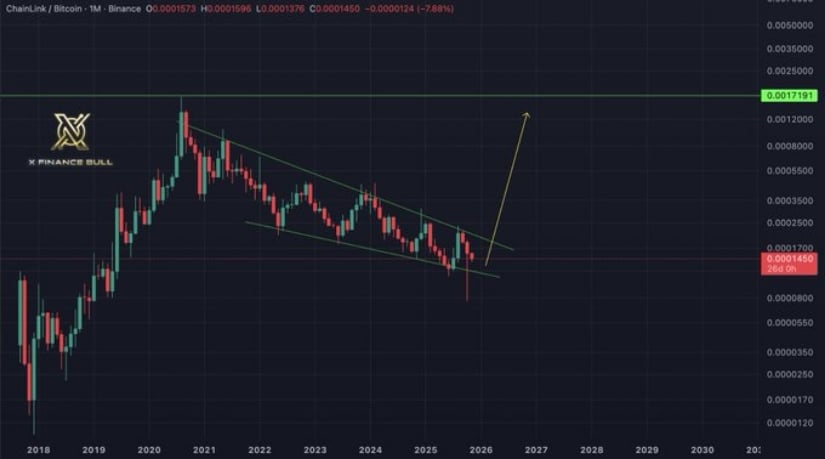
A separate analysis shared by X Finance Bull showcased a falling wedge pattern forming on the LINK price prediction monthly chart, a structure known for signaling macro trend reversals. The chart indicates that the coin may be breaking above the wedge’s upper boundary, suggesting declining bearish pressure and early signs of momentum returning.
Source: X
The analyst connected this breakout with broader network developments, including SWIFT integration, CCIP adoption, and whale accumulation patterns. Historically, wedge breakouts on higher timeframes have preceded long-term appreciation, particularly when accompanied by improving utility demand.
A sustained hold above the breakout line could push the coin toward the 0.0017 BTC region, aligning with the next major resistance. This structural shift supports the ongoing token outlook for gradual recovery.
