Stellar Price Prediction: XLM Primed for Major Breakout as Historical Pattern Repeats

XLM teeters on the edge of a monumental price surge as technical indicators flash bullish signals.
The Setup
Stellar's chart mirrors a familiar historical formation that previously preceded explosive gains. Trading volumes spike while resistance levels show signs of weakening.
Pattern Recognition
Identical consolidation behavior from Q2 2024 repeats itself—narrow trading ranges followed by breakout momentum. Technical analysts point to converging moving averages and rising RSI as confirmation.
Market Dynamics
Institutional interest grows while retail traders remain largely unaware of the brewing storm. Cross-border payment adoption fuels fundamental strength beneath the surface.
The breakout target aligns with previous all-time high territory, though skeptics note the crypto market's fondness for teasing investors with 'sure things' that somehow never materialize.

Analysts across X platforms point to the formation of a large “cup and handle” pattern and historical cycle repetition, both hinting at a major shift in trend structure. After years of consolidation, the coin’s technical setup now signals the possibility of a bullish reversal if momentum continues to build above key resistance levels.
Price Tests Long-Term Trendline as Analyst Flags Bullish Cup Formation
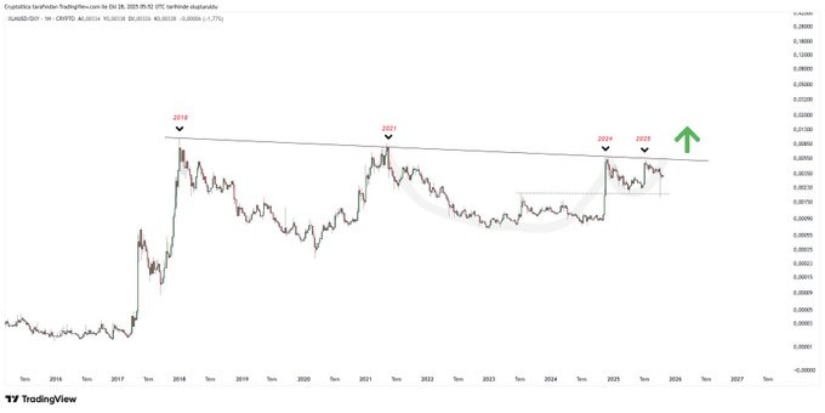
In an X post, Cryptollica highlighted a crucial development in Stellar’s multi-year chart, where price has repeatedly tested resistance from 2017, 2021, 2024, and 2025, forming a clear descending trendline. The analyst noted that the coin is now attempting to break this structure, a MOVE that could redefine its long-term trajectory. The accompanying chart depicts a large “cup and handle” formation that has been building since 2021, with the latest handle phase nearing completion in late 2025.
Source: X
The analysis marked an upward green arrow, symbolizing a potential breakout if the coin closes decisively above resistance. Cryptollica’s commentary “BUY $the coins” encapsulated growing Optimism among technical traders that this could be the turning point after years of suppressed momentum. Should the breakout succeed, the token may enter a new expansion phase, targeting levels not seen since its 2017 and 2021 peaks. However, a failed attempt could lead to renewed sideways action, making the upcoming weeks critical for confirming directional bias.
Market Data Shows the Coin Stabilizing Amid Renewed Trading Interest
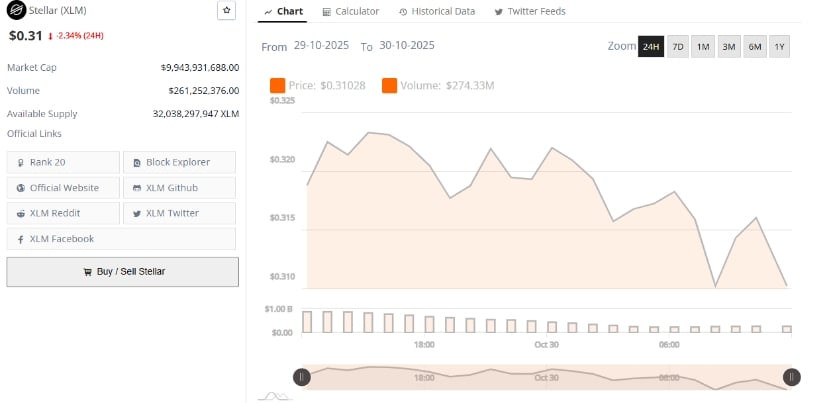
According to BraveNewCoin, stellar currently trades at $0.31, marking a 3.09% increase over the past 24 hours. The network’s market capitalization stands at approximately $9.94 billion, with a daily trading volume exceeding $261 million. The token ranks within the top 20 cryptocurrencies, maintaining consistent liquidity and network activity.
Source: BraveNewCoin
The improved price action reflects strengthening sentiment following extended underperformance throughout the mid-year cycle. Market participants are accumulating, particularly around the $0.31 range, coinciding with the technical base highlighted in long-term analyses.
Historical Cycle Comparison Suggests Major Upside Potential
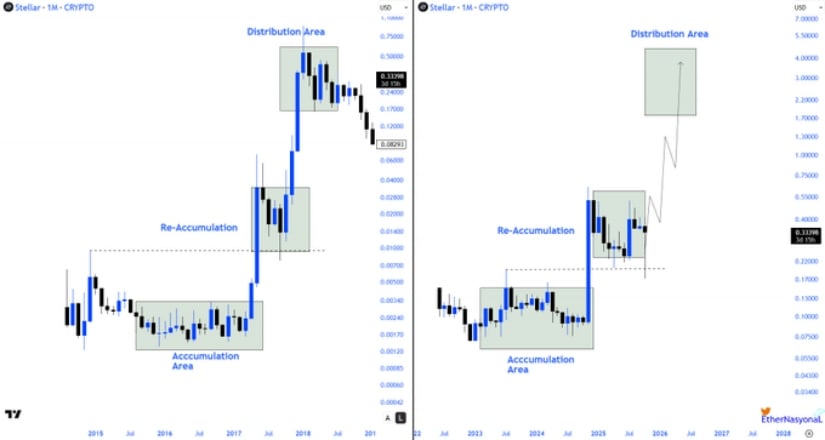
A separate analysis shared by crypto GEMs compared Stellar’s projected market cycles for 2015–2018 and 2023–2026. The left side of the chart details the coin’s previous Wyckoff-style phases, Accumulation, Re-Accumulation, and Distribution, which culminated in a parabolic surge to the 2018 highs. On the right, the current price structure appears to mirror the same pattern, with the analyst labeling it “History Rhymes Again.”
Source: X
According to Crypto GEMs, the coin’s price behavior between 2022 and 2025 reflects a renewed accumulation period, marked by gradually rising lows and muted volatility, classic characteristics of early-stage accumulation. The projection suggests that if the cycle plays out similarly, the coin could advance into a new “Distribution Area” above $2.00, aligning with previous cycle peaks. While not a guarantee, the resemblance between historical and present structures has drawn increased speculative attention.
