HBAR Surges Toward $1.80 Milestone: Bullish Wave Signals Strong Support Foundation

HBAR breaks through resistance levels as technical indicators flash green across the board.
Technical Momentum Builds
The cryptocurrency charts show consistent upward pressure with buying volume accelerating toward the $1.80 target. Market analysts point to the robust support foundation that's held through recent volatility.
Wave Patterns Signal Strength
Bullish wave formations suggest sustained momentum rather than temporary spikes. The pattern mirrors previous breakout scenarios that preceded significant price appreciation cycles.
Institutional Interest Grows
While retail traders chase meme coins, serious money positions itself in assets with actual utility and technical merit. The sophisticated investor recognizes when fundamentals align with technical signals.
Market psychology shifts from cautious optimism to confident accumulation as HBAR demonstrates its resilience. Because nothing says 'sound investment' like chasing price targets while traditional finance still struggles to understand basic blockchain concepts.

Analysts see a potential breakout above $1.80 if the token holds key levels and regains upward momentum.
Analyst Charts Point to Long-Term Bullish Structure
According to analyst ChartNerd, Hedera is forming a long-term setup that could favor an upward breakout. The token trades inside an ascending channel that has guided price action since 2020. Current levels near $0.21 remain close to the lower boundary of this channel, which is offering strong structural support around $0.20.
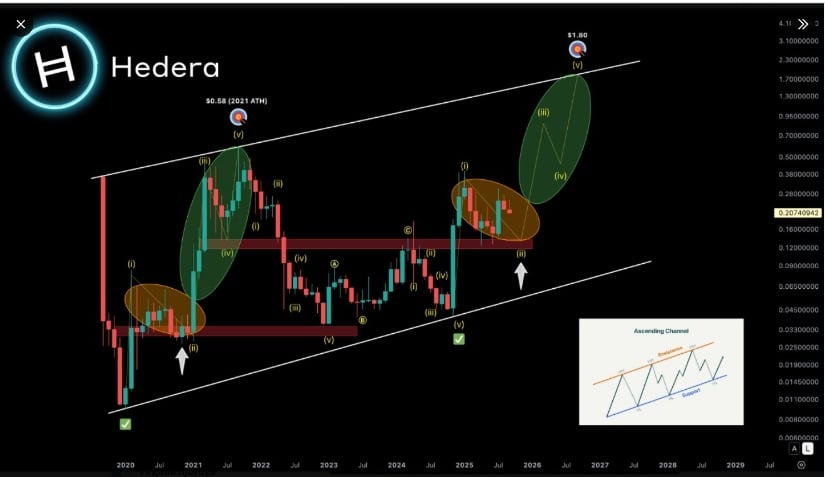
HBARUSD Chart | Source:x
ChartNerd’s analysis suggests a new five-wave cycle may be emerging. The projected path indicates potential price milestones around $0.38 and $0.95 before a possible climb beyond $1.80. The pattern is compared to early 2021, when similar consolidation preceded a surge to its all-time high of $0.58. Maintaining this ascending channel and achieving a confirmed higher low are viewed as key technical developments for this outlook.
Short-Term Pullback May Offer Accumulation Opportunity
WSB Trader Rocko shares a perspective that near-term price weakness might not disrupt a longer-term bullish view. The analyst notes that Hedera could revisit lower levels before resuming an upward move, identifying $0.15 as an attractive accumulation area for those focused on extended investment horizons.
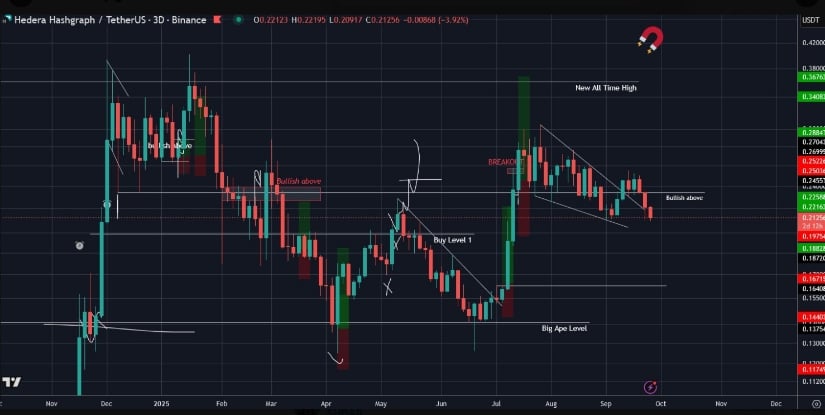
HBARUSDT Chart | Source:x
Rocko’s three-day chart shows the asset trading NEAR $0.21 with additional support levels marked around $0.18 and $0.15. These zones are labeled with “bullish above” indicators, which suggest areas where buying momentum could build if prices stabilize. A sustained defense of the $0.15 region could set the foundation for a strong recovery in the months ahead.
Current Market Performance and Key Levels
Hedera is trading near $0.21 after dropping almost 6% in the past 24 hours. Intraday data shows an early advance toward $0.214, followed by steady selling that pressed the price down to approximately $0.206. Trading volumes have eased, signaling reduced buyer activity as the price retraced from its daily peak.
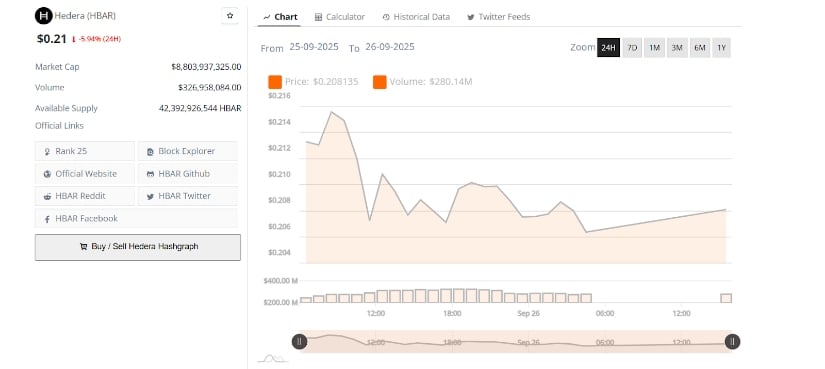
HBARUSD 24-Hr Chart | Source: BraveNewCoin
Immediate support is forming between $0.206 and $0.208, where price action has repeatedly paused before modest rebounds. If this range holds, the token could attempt to retest $0.21 and reclaim lost ground. However, failure to maintain these levels could expose the next lower support around $0.20, an area traders are monitoring closely as a possible pivot point.
Broader Outlook with Wave Pattern and Channel Support
Technical readings continue to center on the long-term ascending channel that has shaped its price movement since 2020. ChartNerd’s wave count indicates that Hedera may be at the start of a fresh impulsive phase. The channel’s lower trendline remains crucial for sustaining this scenario, providing the structural base needed for further advances.
Therefore, a breakout above the $0.22–$0.25 resistance zone could serve as early confirmation of renewed bullish momentum. If the projected wave structure unfolds, it could progress toward intermediate targets of $0.38 and $0.95, eventually aiming for the $1.80 level outlined by the analyst. Market capitalization currently stands at approximately $8.8 billion with a daily volume of about $326 million, reinforcing the token’s position within the broader digital asset market.
