Chainlink Confronts Diagonal Resistance With $31 Target Firmly in View

Chainlink bulls battle critical technical barrier as oracle token eyes next leg up.
Resistance Test Underway
The LINK price faces stiff diagonal resistance that's separating traders from substantial gains. Market watchers see this consolidation as healthy—a necessary breather before the next push toward that coveted $31 target.
Technical Setup Breakdown
Chart patterns reveal a classic accumulation phase. Each rejection at resistance builds stronger support foundations. The $31 level isn't just psychological—it represents a key Fibonacci extension that could trigger algorithmic buying frenzy across major exchanges.
Oracle Network Fundamentals
Beyond technicals, Chainlink's real-world adoption continues expanding while traditional finance still struggles with centralized data feeds—because who needs verified data when you can have trusted third parties, right?
Market Psychology at Play
Traders watching this resistance battle know breakthroughs often come when retail least expects it. The current sideways action shakes out weak hands while institutions accumulate positions quietly.
Price discovery above this barrier could unleash pent-up buying pressure that makes current levels look like distant memory. The path to $31 remains clear—it just requires patience through this technical grind.

Strong trading volume NEAR $839 million underscores active market interest. Holding above $21.30–$21.40 is key for bulls to regain momentum and target higher zones, potentially setting the stage for a strong recovery rally.
Key Zone Under Scrutiny
Chainlink is trading around $21.77, with the $22.00 level acting as a crucial pivot. Analyst crypto Monkey noted in a 4-hour chart update that the price is testing this mark after a period of steady declines. The outcome at this level could determine the next directional move in the market.
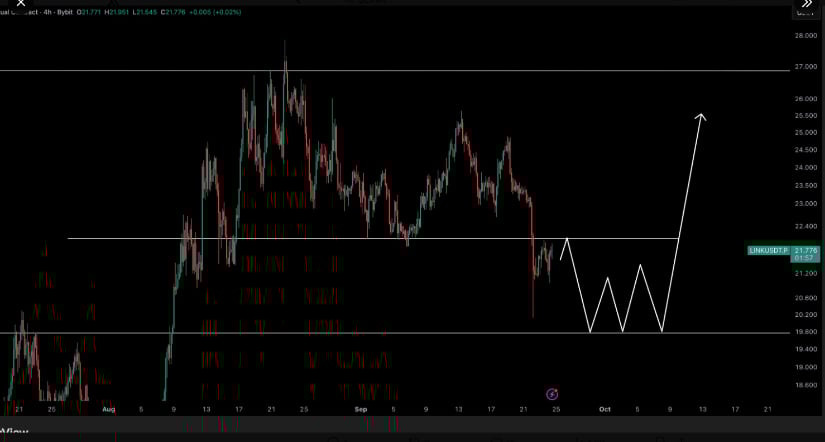
LINKUSDT Chart | Source:x
A rejection at $22.00 may create a short trade opportunity toward the $20.00 area, which remains a key demand zone. The chart indicates this lower level as an important support should sellers gain control. On the other hand, a confirmed breakout and close above $22.00 could attract fresh buying and open the path toward $26.00.
Long-Term Red Diagonal Resistance Limits Upside
Analyst MarketMaestro reported that LINK failed to clear a long-term red diagonal resistance on the monthly chart. This trendline has blocked several upside attempts since the 2021 peak, reinforcing its role as a strong technical barrier. The recent rejection shows that selling pressure remains active at higher levels, keeping immediate support areas under pressure.
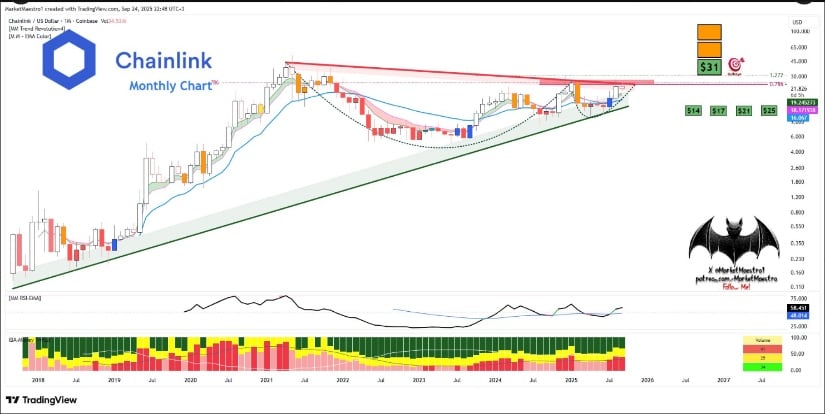
LINKUSDT Chart | Source:x
The analyst outlined key support levels around $14, $17, $21, and $25 as potential demand zones if selling continues. Sustaining strength above these points is essential to prevent a deeper pullback. Momentum indicators suggest that the altcoin needs consistent buying pressure to stabilize and attempt another breakout above the red diagonal resistance.
Long-Term Price Goal Holds at $31
Despite recent rejections, the $31 zone remains the next major target if bullish conditions return. MarketMaestro noted that a decisive monthly close above the red diagonal resistance could shift market sentiment and set the stage for a new upward MOVE toward higher Fibonacci extensions.
For now, the market is watching whether the token consolidates above the key supports to build a base for another rally attempt. A recovery supported by increasing volume and a break above the resistance line could allow chainlink to resume its long-term bullish trajectory and approach the $31 target.
Daily Chart Shows Near-Term Weakness
The 24-hour chart reveals that the asset opened near $21.60 and briefly moved above $21.80 before midday. Selling pressure strengthened later, pushing the price to $21.37 by the session’s end, marking a 1.35% daily loss. This intraday reversal shows sellers were active throughout the session.
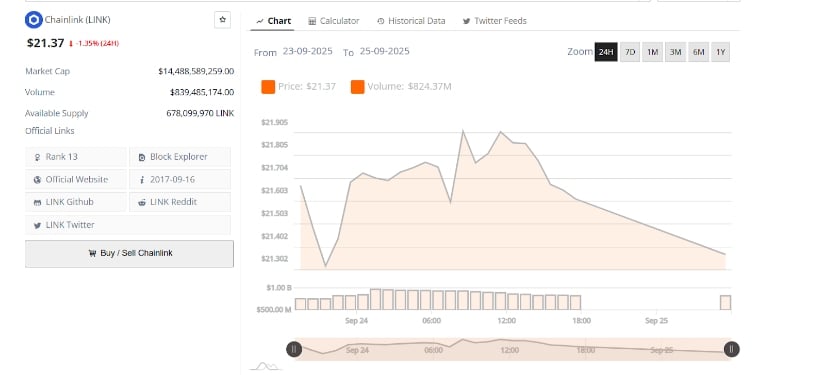
LINKUSD 24-Hr Chart | Source: BraveNewCoin
Trading volume remained strong at about $839 million, with consistent histogram bars confirming sustained market participation rather than thin liquidity. The $21.30–$21.40 area now serves as immediate support. However, a break below this range could lead to deeper retracements if buying interest fades.
With a market capitalization of approximately $14.48 billion and a circulating supply of nearly 678 million, Chainlink holds the 13th spot among major cryptocurrencies. Reclaiming $21.80 is important to re-establish upward momentum in the short term while the broader market watches for a breakout above the red diagonal resistance.
