Solana Price Prediction: Can SOL Defend $200 Support and Reclaim Its Path Towards a New ATH?
Solana faces its moment of truth at the $200 level—a battleground that could determine its next major move.
The Support Line in the Sand
Traders watch the $200 zone with intense focus. This isn't just another number—it's the critical support level that separates bullish momentum from potential correction territory. Break below this, and sentiment could shift rapidly.
Technical Positioning
SOL's chart shows consolidation patterns forming around key moving averages. The network's recent throughput improvements and developer activity provide fundamental backing, but markets rarely reward potential alone. Volume patterns suggest institutional interest remains—though Wall Street's 'risk-on' appetite fluctuates like crypto Twitter's attention span.
Path to New Highs
Reclaiming the upward trajectory requires clearing several resistance levels. Each becomes a stepping stone toward that elusive all-time high. The ecosystem's growth—from DeFi protocols to NFT marketplaces—gives technical traders something beyond lines on a chart to believe in.
Market Dynamics at Play
Broader crypto sentiment plays accomplice or adversary. Bitcoin's dominance, regulatory whispers, and that ever-present fear-of-missing-out versus fear-of-losing-everything pendulum swing. Traditional finance veterans still call it a bubble—right before quietly allocating 1% of their portfolio.
Solana either holds $200 and charges toward history, or joins the graveyard of 'next Ethereum killers.' The blockchain doesn't care about price—but your portfolio certainly does.

Solana’s price action has been stuck in a tricky zone lately, with bulls and bears both fighting for control. After testing the $224 resistance multiple times and failing, the market is beginning to wonder if this momentum is starting to fade.
At the heart of the setup is the $200 support zone. If support holds and resistance flips, the outlook for solana price prediction in 2025 remains bullish, but a breakdown could signal a longer road ahead before any recovery unfolds.
SOL’s Potential Breakdown Towards $200 Zone
SOL Solana price is struggling to hold momentum, with the chart showing repeated rejections near the $224 level. This area has turned into a strong resistance zone, and unless buyers can flip it, the structure leans toward weakness. The price action has been trending lower with a series of lower highs, while volume spikes suggest sellers remain active at every attempt to reclaim higher ground.
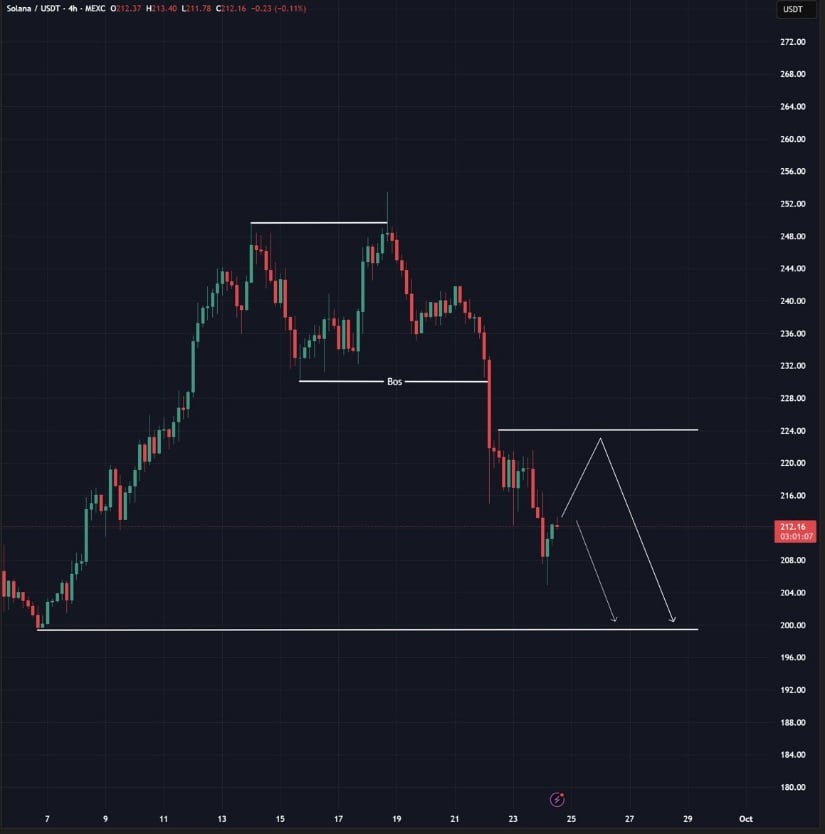
Solana struggles near the $224 resistance, with downside risks pointing toward the $200 support zone. Source: crypto Chiefs via X
If $224 continues to cap the upside, the focus shifts to the downside, where the $200 level stands out as the next key support. A clean breakdown below that mark WOULD expose deeper liquidity zones, potentially dragging the price into the $190 to $185 region. On the flip side, reclaiming and consolidating above $224 could signal a shift in momentum, opening room for a bounce back toward the mid-$240s. For now, Solana’s chart highlights a delicate balance between holding support and facing further downside pressure.
Reversal Signals Emerging at Support
Owing to the emerging bearish outlook, Solana’s latest chart shared by Crypto Seth is showing signs of exhaustion in its recent downtrend, with the price now testing support around the $215 zone. What makes this area interesting is the confluence of the 200 EMA and prior reaction levels, both of which historically acted as strong bases for rebounds. The candles are hinting at a slowdown in selling pressure, and multiple reversal signals are flashing here, suggesting that buyers may be preparing to defend this zone.
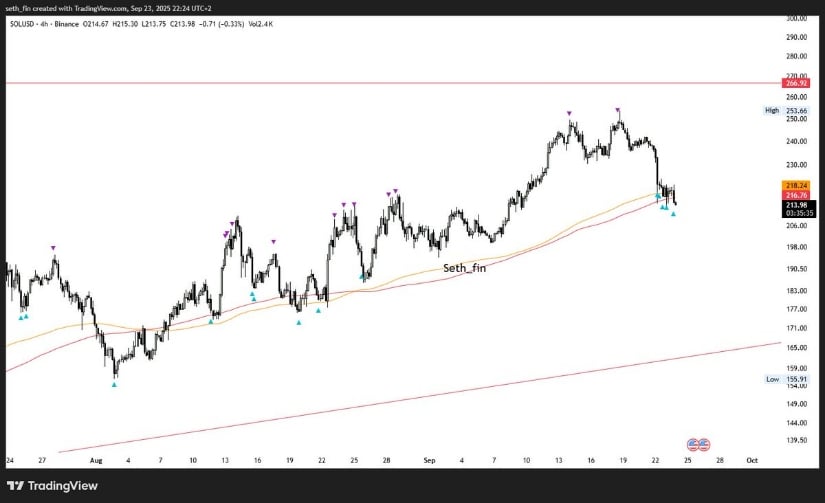
Solana tests the $215 support with reversal signals flashing as buyers look to defend the 200 EMA zone. Source: Crypto Seth via X
While the broader structure remains fragile, the alignment of moving averages here provides a technical cushion. If buyers manage to defend this level, a short-term bounce could develop, potentially retesting the $224 resistance. However, failure to hold would confirm continuation lower, bringing the $200 to $190 zone back into focus.
Solana Price Prediction: Rising Wedge Still Intact
Despite a 15% slide in the past four days, solana remains well within the bounds of its rising wedge formation. The chart highlights how price continues to respect both the upper and lower trendlines, with the current move leaning toward a retest of the lower boundary. Milk Road suggests further near-term downside until the wedge’s support line is reached, aligning with the pattern’s natural rhythm of higher highs and higher lows.
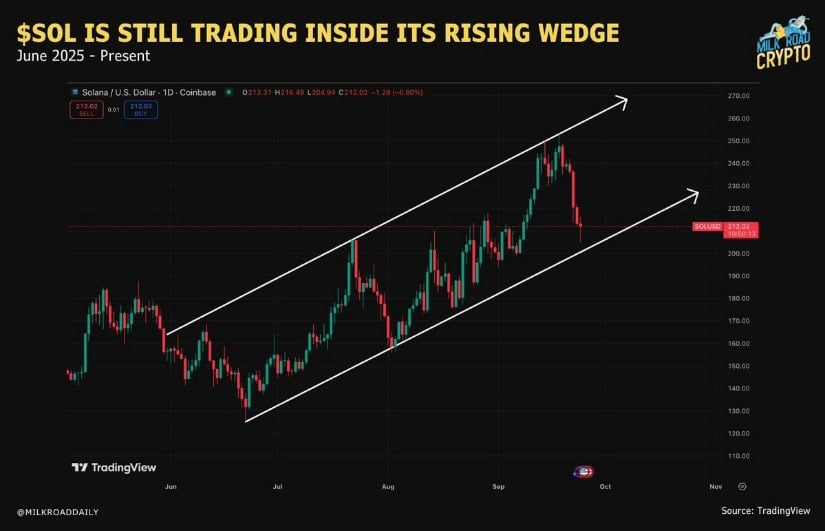
Solana holds within its rising wedge pattern, with downside pressure testing support before a potential rebound towards $280–$300. Source: Milk Road via X
If buyers step in at the wedge’s lower edge, Solana could attempt another climb back toward the top of the structure, keeping the broader bullish framework intact. That path potentially sets the stage for a push towards $280 to $300 over the medium term, provided support holds.
Solana’s Strong Fundamentals
In a volatile market where both bulls and bears are holding equal advantage, Solana’s fundamentals are giving the lead. The ecosystem just reached a new milestone with tokenized real-world assets (RWAs) crossing $671M in value, largely driven by over $150M of inflows into BlackRock’s BUIDL fund.
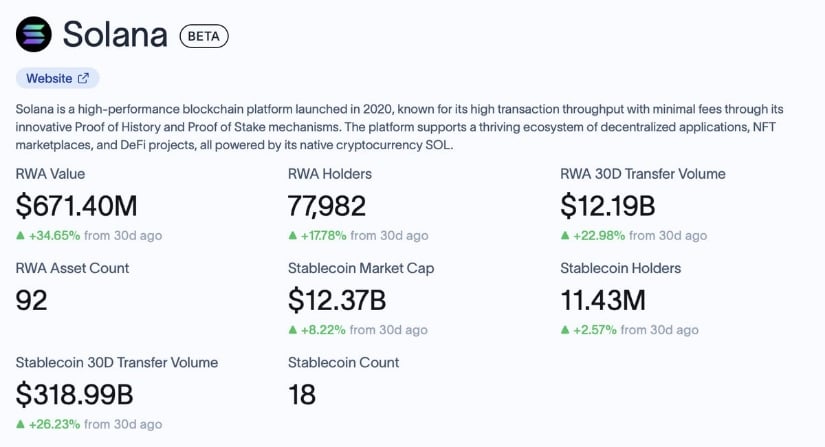
Solana’s ecosystem hits $671M in tokenized RWAs, fueled by $150M inflows into BlackRock’s BUIDL fund. Source: SolanaFloor via X
These steady inflows create a cushion for Solana even while price action remains choppy. Historically, strong institutional demand has helped form more durable bases in assets, and Solana seems to be following that script. If the trend continues, the broader fundamentals may start to flip towards a strong solana price prediction.
Will SOL Be Able To Establish a New ATH in 2025?
Solana is currently trading around $209 after slipping 3.65% in the past 24 hours, placing it at a market cap of $114.6B. The recent pullback has raised questions about whether momentum is fading, but looking at the broader chart, SOL has steadily climbed throughout 2025, hitting higher lows and pushing closer towards its previous all-time high. Trading volumes remain strong, with over $6.4B exchanged in the last 24 hours, showing that participation is still active despite the short-term dip.
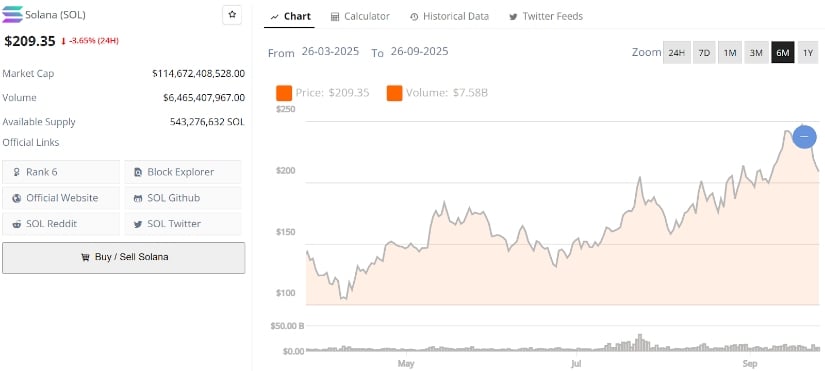
Solana’s current price is $209.35, down -3.65% in the last 24 hours. Source: Brave New Coin
The key technical level to watch remains the $200 support. If Solana can defend this zone and reclaim resistance around $224, it opens the path for another leg higher. A sustained MOVE above $240 to $250 would put SOL firmly back in contention for an ATH challenge later this year.

