Worldcoin Surges 6% From Critical Demand Zone - Bulls Target $1.50 Breakout

Worldcoin ignites as buying pressure erupts from key support level.
Momentum Builds Toward $1.50
Traders pile into positions as technical alignment suggests upward trajectory. The 6% bounce signals renewed confidence after finding solid footing at the demand zone. Market watchers note the clean rejection of lower prices creates ideal setup for continuation.
Patterns Point to Bullish Resolution
Chart formations indicate growing institutional interest despite traditional finance skeptics questioning whether this is another crypto pump destined for correction. The precise 6% move demonstrates calculated accumulation rather than speculative frenzy.
Price action now tests resistance levels that previously capped advances. A decisive break above $1.50 would confirm the bullish thesis and potentially trigger algorithmic buying programs. Of course, Wall Street analysts remain blissfully unaware that retail traders spotted this setup weeks ago.

Analyst Tawfeeq highlights that WLD already posted a 6% rebound from $1.3080 without leverage, underscoring strong buying interest around this base. The 4-hour chart shows active market participation, with current trading NEAR $1.34 and 24-hour volume of $406.9 million, reinforcing solid liquidity.
This consolidation zone is crucial for its short-term and medium-term outlook. A sustained hold above the $1.30–$1.40 area could trigger a broader pump, with initial resistance at $1.37–$1.40 and potential upside toward $1.50 and $1.64. Conversely, failure to defend this level may open deeper corrections toward $1.21 and $1.13.
Price Rebounds From Key Demand Zone
Worldcoin posted a 6% rebound after touching a strong demand zone between $1.18 and $1.30, according to analyst Tawfeeq. His 4-hour TradingView chart showed that the token gained around 6% from the $1.3080 level without leverage. The price area has served as a steady support range since early September and is being retested after a multi-week decline from levels above $2.20.
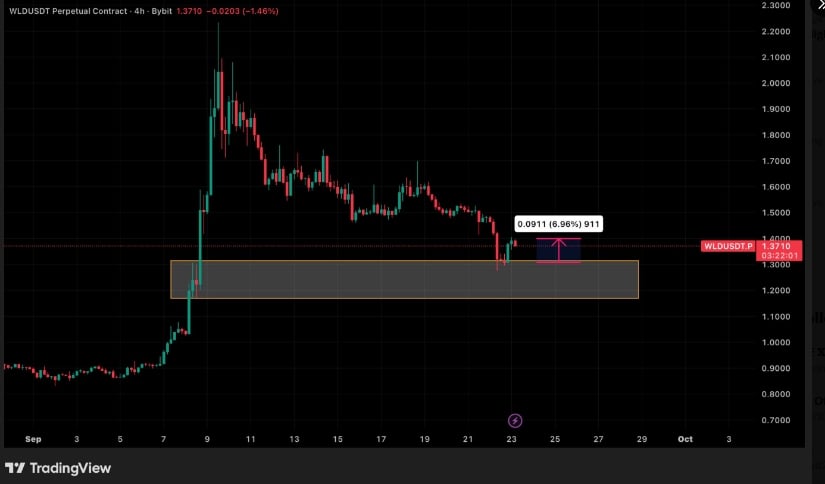
WLDUSDT Chart | Source:x
Tawfeeq stated that if the market holds this support zone, the current upward push may continue toward higher levels. The immediate resistance sits near $1.37 to $1.40, an area where sellers previously limited upside moves. A close above this range could encourage further buying from both spot and derivatives traders, increasing the possibility of reaching the $1.50 mark.
Short-Term Support and Trading Activity
Worldcoin traded at $1.34, recording a 1.23% gain in the past 24 hours. Trading data show that the crypto opened near $1.30 and reached an intraday high of around $1.38 before pulling back to current levels. This movement was supported by a 24-hour trading volume of about $406.9 million, pointing to sustained market participation and liquidity.
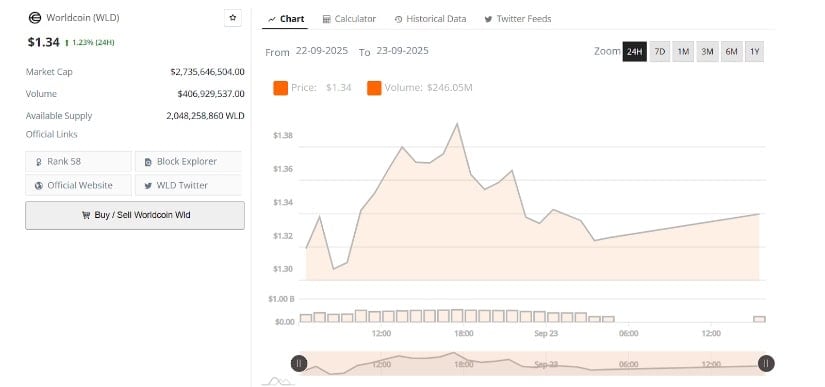
WLDUSD Chart | Source: BraveNewCoin
Price action during the session included an early strong advance, followed by a gradual retracement. After peaking near $1.38, the altcoin corrected but stabilized above $1.32, where buying interest increased. This behavior suggests the $1.32–$1.34 range is acting as a near-term support zone, offering a base for any further attempts to revisit recent highs.
Market Position and Key Levels Ahead
With a market capitalization of around $2.73 billion and a circulating supply of over 2.04 billion tokens, Worldcoin ranks 58th among cryptocurrencies by market value. Analysts say sustained buying and a stable market could push it past $1.36–$1.38, targeting a potential move toward $1.50.
Maintaining support above the $1.30 zone remains essential for sustaining the current recovery. A close above $1.40 strengthens the outlook, while a drop below key demand risks deeper support tests and longer consolidation.
Daily Chart Signals From Broader Analysis
A daily chart shared by an analyst shows WLD/USDT trading near a horizontal zone of $1.30–$1.40. This area acted as strong resistance earlier in the year and is now serving as an important support level. Following a sharp rally to $2.20, the price has corrected through a series of downward moves and is now testing this reclaimed support.
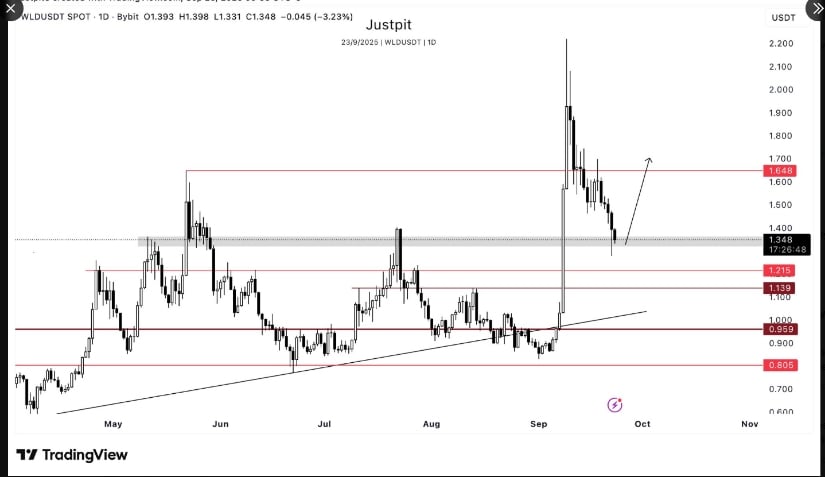
WLDUSDT Chart | Source:x
If the asset manages to hold above this range, the projection points to a possible climb toward $1.64, which is the next major resistance. A daily close above $1.64 could pave the way for a MOVE toward the $1.80–$2.00 zone. However, failure to hold this grey support area could lead to declines toward $1.21, $1.13, or even $0.95, as indicated by the lower horizontal markers on the chart. The coming daily closes will be crucial for confirming the medium-term direction.
