Sei Crypto Price Prediction: Buy Signal Flashes After Heavy Selloff - Here’s Why Traders Are Bullish

Sei Network's native token flashes its first major buy signal since the brutal September selloff crushed crypto markets.
Technical Breakout Confirmed
The SEI/USDT chart paints a clear picture: after bleeding out for weeks, key momentum indicators just flipped green. The RSI climbed from oversold territory while trading volume spiked 40% during yesterday's reversal candle.
Ecosystem Momentum Builds
Developers keep shipping despite market conditions. Three major dApps launched on Sei's blockchain last week alone—a decentralized exchange, NFT marketplace, and prediction market protocol all going live while traditional finance CEOs still debate whether crypto is 'real.'
Price Targets Set
Traders eyeing the $0.85 resistance level as the next major test. A clean break above could trigger a 30% rally toward the $1.10 zone where heavy selling pressure awaits. The 200-day moving average currently sits at $0.92—a critical psychological barrier.
Risk Factors Remain
Not all sunshine and rainbows. The token still trades 60% below its all-time high, and broader market sentiment remains fragile. One whale movement could wipe out these nascent gains faster than a Wall Street banker's moral compass.
Bottom line: The setup looks promising for swing traders, but keep stops tight. In crypto, today's buy signal can become tomorrow's 'what were we thinking' faster than you can say 'leveraged long liquidation.'

Traders are now watching closely to see if this marks the start of a recovery from oversold conditions.
TD Sequential Signals Possible Reversal
The 4-hour chart shows SEI trading at $0.288 after a steep correction from highs NEAR $0.35 earlier this week. The recent selloff pushed the token into heavily oversold territory, and now the TD Sequential indicator has flipped into a buy setup at the monthly open. This shift comes after the same tool successfully signaled the previous market top, giving weight to its current bullish call.
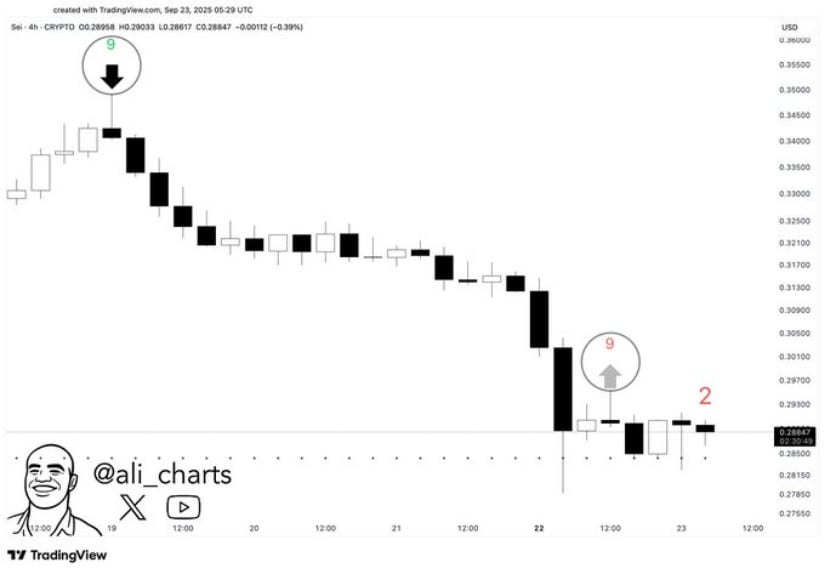
Source: X
Volume analysis also highlights increased activity during the sharp drop, suggesting that capitulation may have occurred as weaker hands exited their positions. The quick bounce from the $0.278 low further reinforces the idea that sellers could be losing momentum. If this support level holds, the asset may have already established a near-term bottom.
Looking forward, the first hurdle for bulls is reclaiming the $0.30 level, which would confirm early recovery momentum. A break above this zone could open the way toward $0.32–$0.33, while failure to hold $0.278 risks extending the decline. With the buy signal in play, the crypto finds itself at a critical juncture where trader conviction will dictate the next big move.
Buy Signal Gains Momentum Amid Market Pullback
Analyst Ali’s bullish call is supported by BraveNewCoin data, which shows the token trading at $0.29, down 5.60% in the past 24 hours, with a market cap of $1.74 billion and a trading volume of $183 million.
Despite the decline, the TD Sequential indicator flashing a buy setup suggests the recent weakness may be setting the stage for a reversal, especially as price action finds support near $0.28.
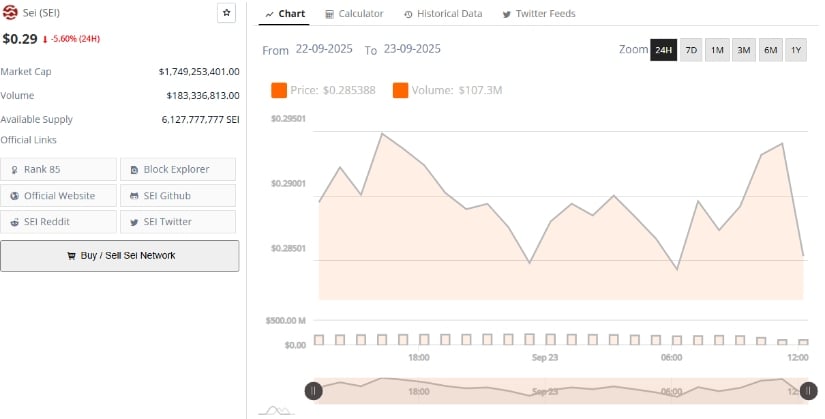
Source: Bravenewcoin
The broader data highlights strong liquidity, with over 6.12 billion tokens in circulation and steady trading activity. If the $0.28 level holds and price climbs back above $0.30, it could confirm bullish momentum, opening the path toward $0.32 in the near term. This alignment of technical signals and market structure strengthens the view that downside pressure may be easing.
Here’s a clean version with a strong subheading and two detailed paragraphs:
Momentum Weakness Persists Despite Daily Gains
At press time, SEI/USDT is trading at $0.2951, reflecting a modest 1.72% daily increase, yet technical indicators suggest the recovery lacks strength. The MACD line sits at 0.0004 below the signal line at 0.0040, while the histogram remains negative at -0.0036, hinting at mild bearish pressure.
Price action continues to face resistance between $0.3500 and $0.3900, while stronger support is found closer to $0.1300, creating a wide range that underscores the uncertainty in short-term direction.
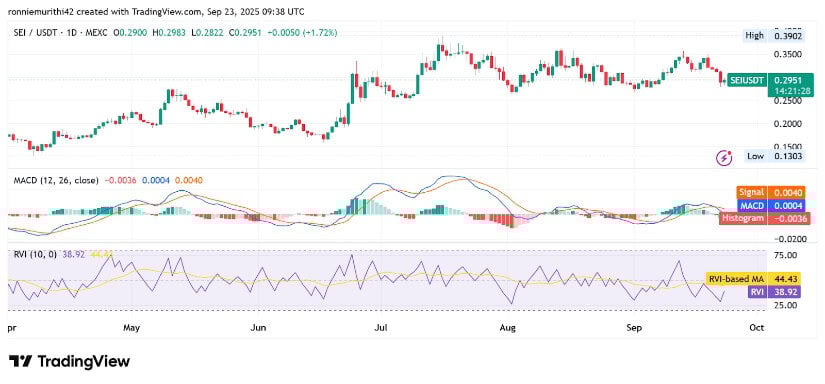
Source: TradingView
The Relative Vigor Index (RVI) further highlights this caution, printing at 38.92 below its moving average of 44.43. With the RVI failing to climb above its average and staying well under the neutral 50 mark, bullish conviction remains weak.
Therefore, the movement in recent sessions reflects hesitation from both buyers and sellers, making a clear breakout unlikely until momentum strengthens. For now, traders may prefer to wait for decisive signals, particularly a bullish MACD crossover, before positioning aggressively.
