Chart Builder: From Signal to Story - Turning Data into Market Narratives

Crypto's latest toolkit transforms raw numbers into compelling visual narratives—because in digital assets, if you can't show it, you don't own it.
The Art of Visual Storytelling
Forget spreadsheets. Today's traders demand instant clarity—charting tools now convert complex on-chain data and market signals into actionable intelligence within seconds. No more squinting at candlestick patterns or wrestling with indicators.
From Noise to Narrative
These platforms aggregate liquidity flows, social sentiment, and technical indicators into coherent visual stories. They spot trends before they trend—identifying everything from whale movements to retail FOMO patterns that traditional finance would need weeks to process.
Why It Matters Now
With volatility hitting new extremes, visual storytelling isn't just nice-to-have—it's survival. Traders using advanced charting tools reported 40% faster decision-making during last month's flash crash. Meanwhile, traditional analysts are still drawing lines on Bloomberg terminals.
The bottom line? In crypto, the best story wins—and now the charts are writing themselves. Just don't tell your fund manager.
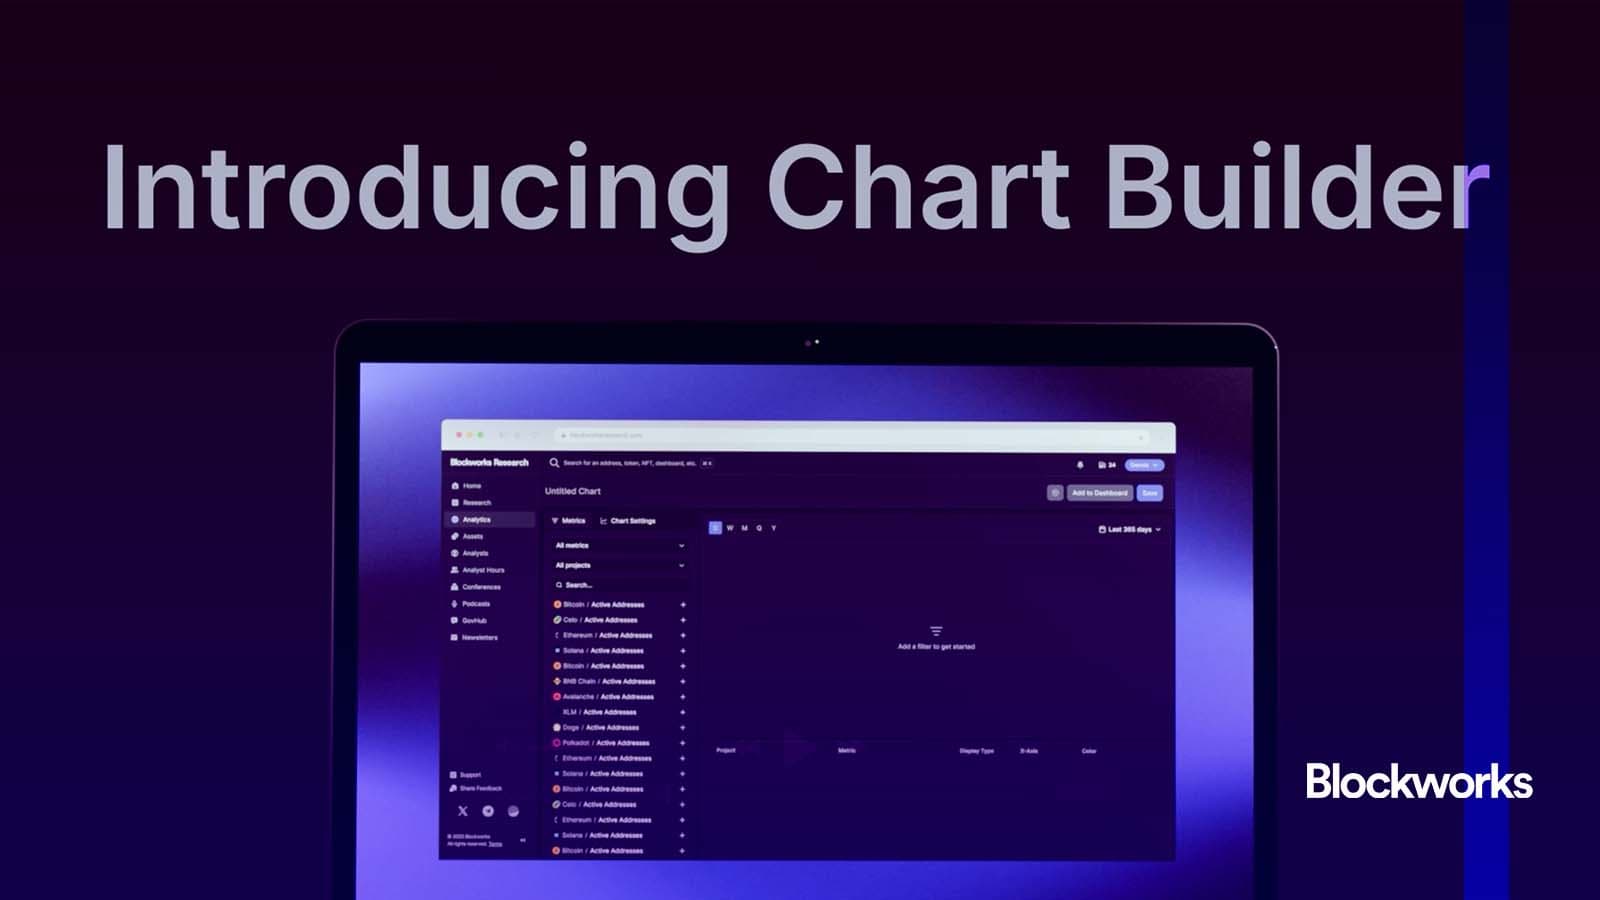
Why Chart Builder?
- Design the view, not the pipeline. Start from Blockworks’ validated data and mold the visual that tells the truth fastest.
- Move from idea to insight in minutes. Compare signals, switch lenses, annotate the story. No CSV babysitting, just the insight you need immediately.
- Flexible by design. Lines, bars, areas, tables; single series or comparisons; quick filters and timeframes that match the way you work.
- Consistency you can trust. Every chart is fed by the same warehouse that powers Blockworks Research.
Pick what you need from the catalog, shape the presentation, and save it. That’s it. Your definitions stay intact; your charts stay fresh.
Integrated with Dashboard Builder
Chart Builder now slots directly into. Build a chart once, thenalongside tables, notes, and other tiles.
Create a living view of the KPIs that matter, keep narrative context in one place, and let everything update automatically. No screenshots, no manual refresh cycles. All of your signal in one place.
You could build:
- A set of focused KPI tiles focused on the things you care about.
- A side-by-side comparison that shows you clear market share trends in a given sector.
- A leaderboard table that ranks your favorite metrics across all time periods.
- A daily-refreshing table for reporting that completely replaces the team’s monotonous work.
The possibilities are immense when you combine the depth of Blockworks data with the flexibility of crafting your own charts and dashboards in one elegant interface.
Try it today
Chart Builder is live inside Blockworks Research. Open it, shape the view, and pin it to your dashboard.
Less wrangling. More decisions.
Questions or ideas?.
- The Breakdown: Decoding crypto and the markets. Daily.
- 0xResearch: Alpha in your inbox. Think like an analyst.
- Empire: Crypto news and analysis to start your day.
- Forward Guidance: The intersection of crypto, macro and policy.
- The Drop: Apps, games, memes and more.
- Lightspeed: All things Solana.
- Supply Shock: Bitcoin, bitcoin, bitcoin.
