Bitcoin’s Halving Cycle Signals Imminent Price Breakout – Here’s Why
Bitcoin's ticking like a post-halving time bomb—and the fuse is shorter than Wall Street's memory.
The Pattern That Never Lies
Four-year cycles. Supply shocks. Institutional FOMO. The script writes itself every time Bitcoin’s block rewards get slashed in half. Now? We’re right on schedule for the explosive act three.
Miners vs. Markets
When the mining reward gets cut, weak hands fold. Hash rate wobbles. Then—like clockwork—the surviving miners hoard while ETFs and hedge funds scramble for crumbs. This isn’t speculation; it’s arithmetic.
The Cynic’s Corner
Sure, traditional finance will pretend to ‘discover’ Bitcoin’s scarcity narrative… again. Just don’t expect them to mention they’re late to the party—as usual.

With its price firmly below $120,000, Bitcoin is set to start the week of its present "price discovery uptrend" on Monday.
According to trader and analyst Rekt Capital, if bitcoin continues to follow its past trends, it could revisit its recent $124,500 all-time high.

As part of its bull market update, Rekt Capital informed X followers that Bitcoin is set to begin its second "price discovery uptrend" since its 2024 halving, which will last for around seven weeks.
A pattern exists where uptrends are followed by corrections in the bull market that occurs after each halving event. Over Bitcoin's lifetime, the timing of each phase has remained rather consistent.
#BTC
Historically, Bitcoin price Discovery Uptrend 1 tends to end between Week 6 & 8 of its uptrend
Whereas in Price Discovery Uptrend 2, Bitcoin tends to end its uptrend between Week 5 & 7
Week 7 of Price Discovery Uptrend 2 begins tomorrow$BTC #Crypto #Bitcoin https://t.co/dw8Liuw2PP
Typical of prior halving cycles, Bitcoin's price fell from around $110,000 to below $75,000 this year during its first corrective phase, a drop of almost 30%.
Separately, another trader, Daan crypto Trades, observed that BTCUSD has yet to produce consecutive “green” months in August and September.
Nonetheless, a decline might set the stage for a more significant peak as we approach year-end.
$BTC August has been pretty uneventful for Bitcoin so far. We've seen some movement but no clear direction as price consolidates in this current range.
Never in history, has BTC seen both a green August and September. We tend to see a quick flush followed by an explosive Q4 in… pic.twitter.com/cClxJUG6Vh
Data from the tracking portal CoinGlass shows that BTCUSD has climbed 2.1% in August, somewhat higher than the average gain of 1.8%. September, on the other hand, typically shows a 3.8% drop in prices.
TradingView' chart shows that at the moment, Bitcoin is back at the bottom of its protracted upward channel, which raises the possibility of a bearish breakout after a long period of stability within this structure.
A significant support zone exists around the $110,000 mark, and the nearby 100-day moving average also provides support if prices begin to decline.
On the other hand, should the channel successfully hold the price, the upward momentum could persist, setting the stage for new peaks around $130K and possibly beyond.

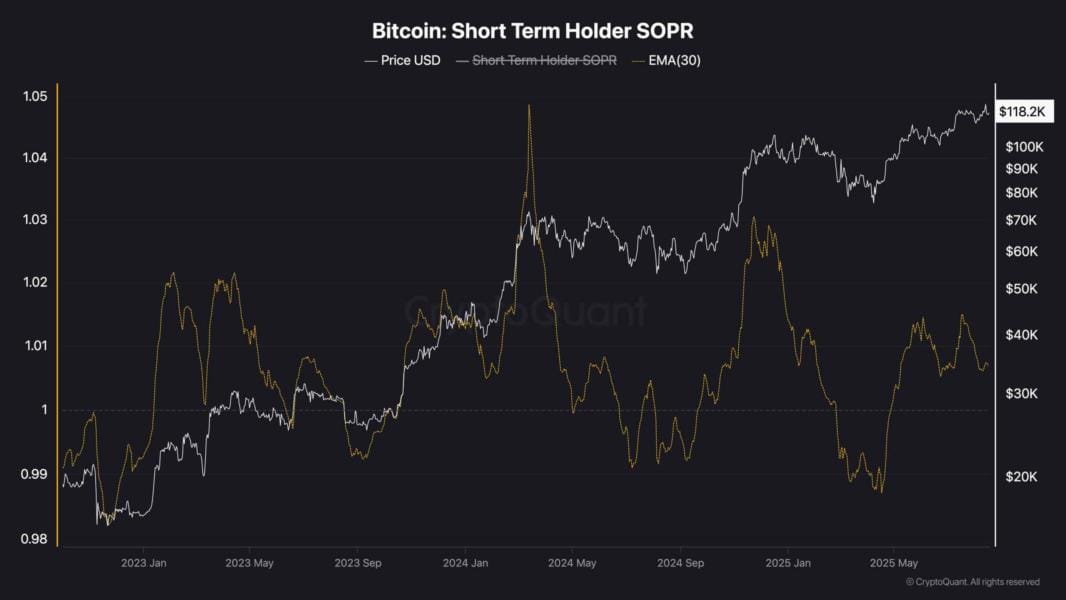
Analyzing the Short-Term Holder SOPR of Bitcoin alongside its 30-day EMA in relation to price movements. A SOPR value exceeding 1 indicates that short-term holders are realizing profits, whereas a value below 1 suggests they are incurring losses on their sales.
In periods of upward movement, such as early 2023, SOPR remained above 1, indicating that profit-taking was occurring. Conversely, declines below the 1 level indicate that immediate capitulation occurs during market corrections.
Currently, with Bitcoin priced at approximately $118K and the SOPR remaining above 1, short-term holders are capitalizing on their gains.

However, the level of profit-taking has been decreasing during the recent price peaks observed since the beginning of 2024. This observation is apparent, as a distinct divergence exists between the price highs and the STH-SOPR highs.
The diminishing profit margins for short-term holders indicate potential trouble ahead for the market, as they could serve as an early signal of a reversal.
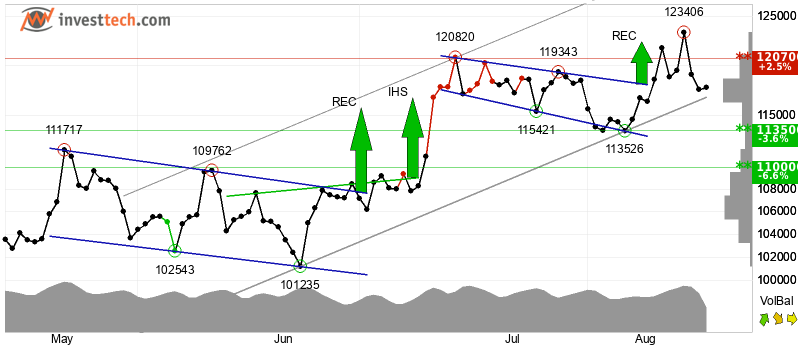
Separately, InvestTech's Algorithmic Overall Analysis assigned a positive score to Bitcoin. In the short term, InvestTech's recommendation for a period of one to six weeks indicated that Bitcoin is currently exhibiting an upward trajectory within a rising trend channel.
This reflects growing confidence among stakeholders and suggests a sustained upward trend. A notable breach of $118,077 will once more provide encouraging indications for the OG token, whereas a decline on the contrary side of the formation will serve as a robust negative indicator.
The analysis showed that Bitcoin exhibits support levels at $113,500 and resistance levels at $120,700. The RSI curve indicates an upward trajectory, reinforcing the favorable trend. The currency is generally evaluated as having a favorable technical outlook for the NEAR term.

Separately, SoSoValue data showed a Daily Total Net Open Interest (Delta) of -$1.83 billion, indicating an increase in open contracts for puts.
This trend suggests that market makers need to sell underlying assets to hedge their positions, resulting in the sale of more ETFs, indicating a need for a broader push for cryptos to recover and rise back to new all-time highs.
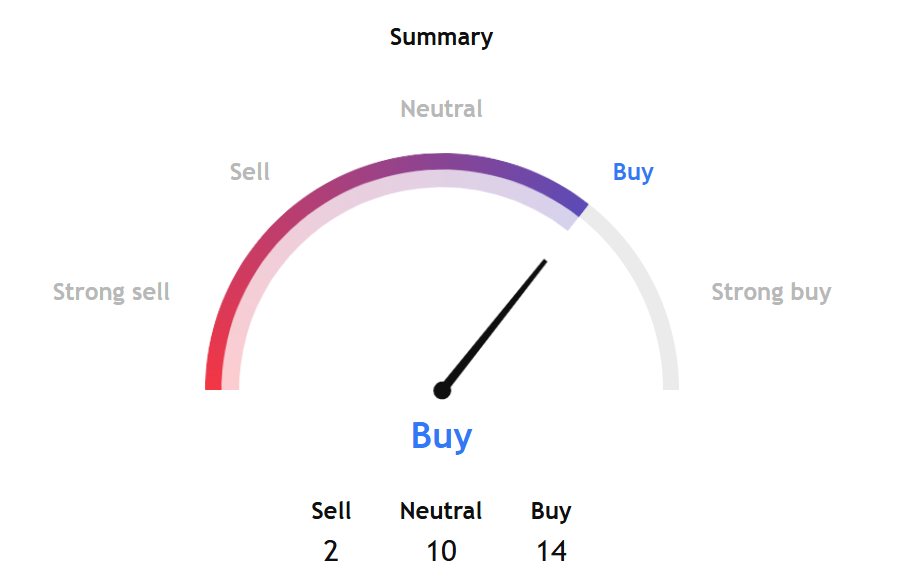
TradingView's BTCUSD technical analysis gauge shows a 'buy' signal for the week ahead.
However, a DEEP dive into the summary of Bitcoin based on the most popular technical indicators, such as moving averages, oscillators, and pivots, showed two sub-gauges reflecting a sell signal.

The indicators under the broader oscillators gauge gave a neutral signal, from a buy signal last week. However, the indicators based on moving averages reflected very positive momentum and a strong buy signal, while only the Hull Moving Average (9) gauge indicated a sell.

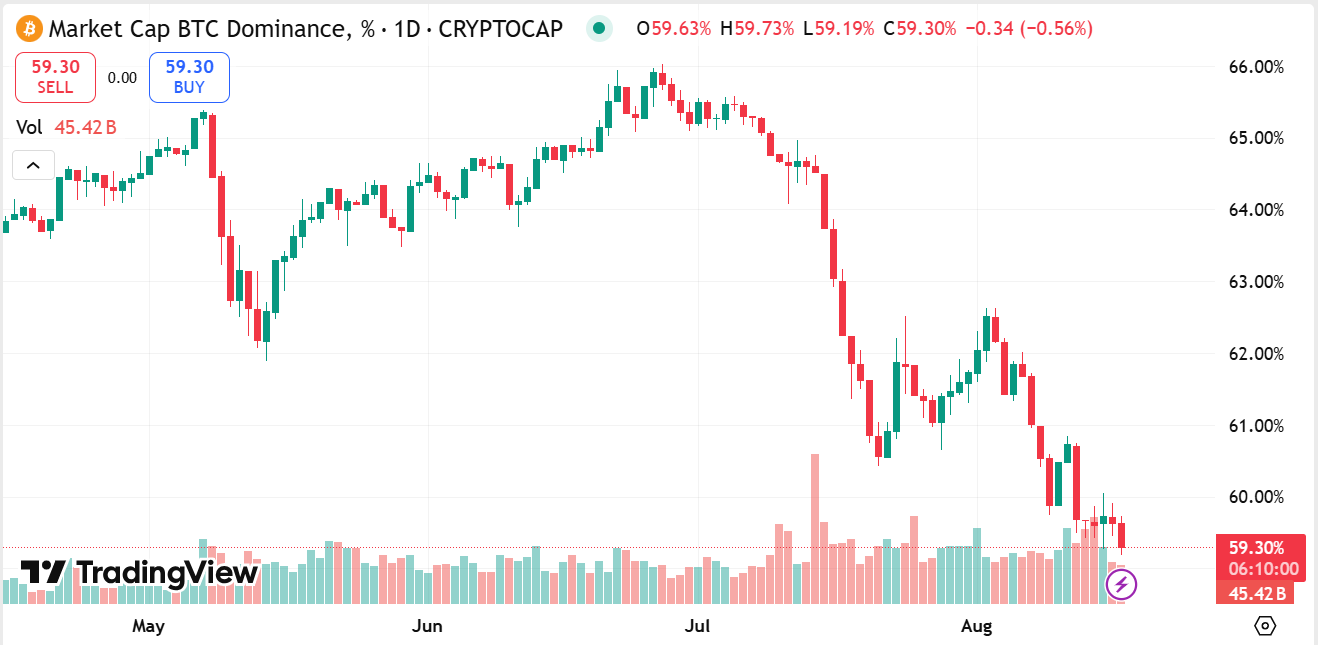
TradingView's Market Cap BTC Dominance as a percentage, which calculates Bitcoin's dominance as a ratio of its market cap to the cumulative market cap of other cryptocurrencies, showed a weakening trend.
That suggests even within the crypto universe, Bitcoin seems to have lost some momentum.
Stay ahead of the curve with the latest industry news on Blockhead’s Telegram channel!
