🚀 Ethereum Soars Past $4,000 on Surging Volume—$6,800 Target in Sight

Ethereum just blasted through the $4,000 barrier—fueled by a tidal wave of trading volume that’s got bulls eyeing a $6,800 moonshot.
High-velocity breakout: The second-largest crypto isn’t just climbing—it’s sprinting, leaving skeptics scrambling to explain the move (and bagholders from 2021 finally breaking even).
Target locked: If this rally holds, ETH could rewrite its all-time high playbook—assuming Wall Street doesn’t ‘discover’ blockchain again and ruin everything.
Bonus cynicism: Traders are already pricing in the inevitable ‘Ethereum ETF’ narrative—because nothing screams decentralization like a BlackRock prospectus.

- Ethereum breaks $4,000 with high volume, setting sights on $6,800 by early 2026.
- MACD bullish crossover and positive histogram confirm strong upward momentum.
- RSI above 70 signals intense buying pressure but supports continued trend strength.
Ethereum has recorded a weekly breakout above the $4,000 level, marking its strongest upward move in months. The rally, supported by an increase in trading volume, positions the cryptocurrency for a possible longer bullish phase in the months ahead.
At the time of writing, ethereum was trading at $4,178.08, up 7.11% over the past 24 hours. The move was accompanied by a 30.06% rise in trading activity, with 24-hour volume reaching $50.31 billion. Market capitalization climbed to $504.33 billion, matching the fully diluted valuation, as the circulating supply remained steady at 120.7 million ETH.
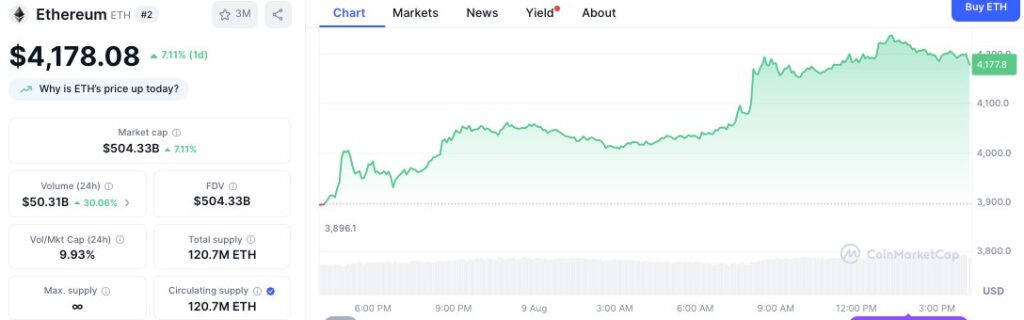
The price action displayed ongoing gains throughout the day. Ethereum began trading below $3,900 before advancing, reaching the $4,100 mark in mid-morning trade. It then consolidated near $4,200, confirming strong buying interest during the session.
Breakout Structure and Technical Projection
The weekly chart shows Ethereum breaking a resistance zone NEAR $4,000, a level that previously capped upward movement. Technical analysis of the breakout points to a recorded move projection of $2,687 above the breakout point. This sets a possible price target near $6,800 by early 2026, representing an estimated 65.5% increase from the breakout level of $4,100.
$ETH 1W linear chart
This is probably the most #bullish macro chart I’ve seen in a while pic.twitter.com/CNCI88U1g0
The projection is based on the height of the prior consolidation range and the breakout base. Similar patterns were observed during Ethereum’s 2021 peak, when a prolonged consolidation preceded a strong price surge.
MACD and RSI Indicators Signal Momentum
Technical indicators confirm the current bullish inclination. The Moving Average Convergence Divergence (MACD) line, at 10.35, has crossed above the signal line at 185.96, showing a shift toward positive momentum. Histogram values have moved from negative to positive territory, reinforcing the likelihood of continued upward pressure.
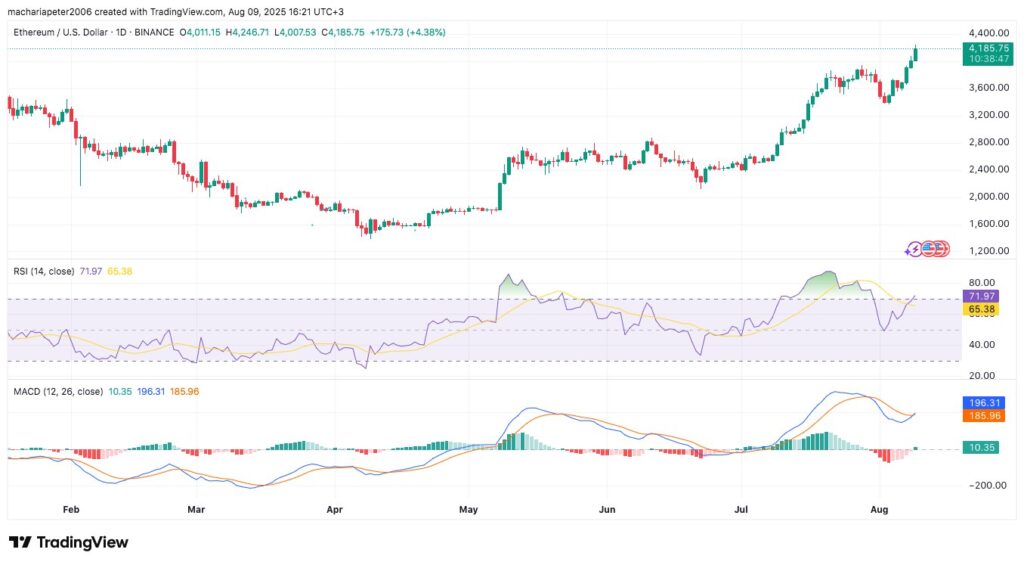
The Relative Strength Index (RSI) is currently at 71.97, exceeding the 70 mark often associated with overbought conditions. While this reading points to a strong buying activity, the RSI’s position above its 14-day moving average of 65.38 signals a continuation of the trend rather than immediate reversal pressure.
