Ethereum Nails Key Resistance – Can Bulls Shatter the Ceiling as Support Holds Strong?

Ethereum's price action is flirting with a make-or-break moment. The second-largest crypto asset is testing a critical resistance level while traders watch support zones like hawks—will this be the breakout or another fakeout?
Market Pulse: ETH's Do-or-Die Zone
The charts show ETH dancing at a technical inflection point. Every failed breakout attempt builds more pressure—like a coiled spring or a ticking bomb, depending on your portfolio exposure.
Support Levels: The Safety Net Everyone's Watching
Those key support areas aren't just lines on a chart—they're the psychological battleground where panic selling meets diamond-handed conviction. Break them, and even the moonboys might start sweating.
Meanwhile, Wall Street 'experts' still can't decide if crypto is dead or the greatest invention since compound interest—but their hedge funds keep quietly accumulating. Funny how that works.

- Ethereum finds strong support between $3,200 and $3,400 with 70% bounce probability.
- Resistance near $4,100 may cause price consolidation or stop-loss sweeps.
- RSI shows buying pressure; MACD signals possible short-term consolidation ahead.
Ethereum (ETH) has recently shown a price recovery, trading around $3,901 on the 4-hour chart. The token recovered strongly from lows NEAR $3,300, drawing attention to price levels that could influence its short-term trend.
Great MOVE of $ETH, taking all the liquidity on the short side.
If this goes back to $3,700-3,750, might be good for a daytrade targeting $4,100+. pic.twitter.com/T3Jldw69AW
The primary support zone identified lies between $3,200 and $3,400. This area is considered a strong possibility for price bounces, with about a 70% probability of holding as a support level. In more bearish scenarios, a further support region is observed near $2,900 to $3,000. This zone carries a lower probability of acting as support, approximately 30%, but remains major if international tensions or macroeconomic factors trigger a deeper sell-off.
Resistance Near $4,100 Could Stall Upward Momentum
On the upward trend, the $4,100 mark is identified as a resistance zone. Additionally, price action is likely to pause here, allowing for consolidation or the clearing of stop-loss orders before a further advance.

Source: X
Moreover, volume analysis supports the presence of active trading around these key levels, with spikes in volume aligning with key price moves. These volume patterns provide additional context for the strength and validity of the identified support and resistance zones.
Technical Indicators Show Mixed Momentum Signals
The Relative Strength Index (RSI) is at 65.72, which is below the 70 overbought area. This indicator suggests constant buying support but warns that the market is getting towards becoming overbought. The RSI holding above 50 shows that buyers have not lost dominance yet, which explains the recent price gain above $3,900.
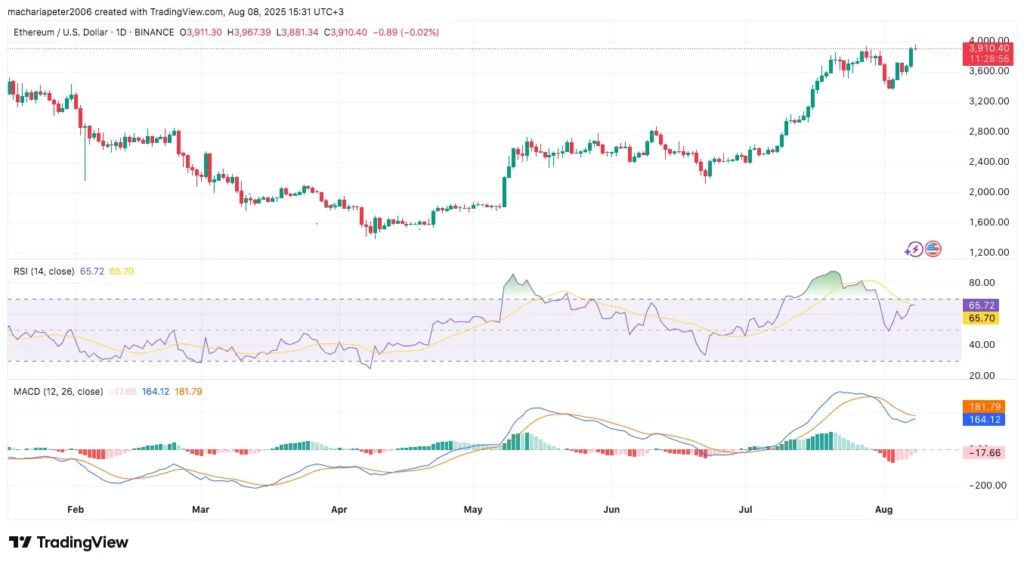
In contrast, the Moving Average Convergence Divergence (MACD) indicator signals a short-term weakening in momentum. The MACD line at 164.12 remains below the signal line at 181.79, indicating a bearish crossover. The MACD histogram shows a negative value of -17.66, confirming a decline in upward momentum. This setup points to possible consolidation or a minor retracement in the near term.
However, the MACD’s distance to the signal line signals that renewed buying pressure could reverse this trend. A bullish crossover WOULD indicate a return to stronger momentum and align with the RSI’s bullish stance.
