Bitcoin Steals the Spotlight Again as Altcoins Struggle to Keep Up

The crypto market's narrative flipped hard this week—BTC's rally left altcoins eating dust while traders piled back into the king.
Dominance game strong
Bitcoin's market cap share surged as capital rotated out of riskier plays. No surprise here—when volatility spikes, crypto tourists always sprint back to 'digital gold.' Meanwhile, altcoin teams keep burning VC money on marketing instead of building actual utility.
Sentiment shift
Traders dumped speculative tokens faster than a hot NFT project after the hype cycle. The smart money? Parking profits in BTC while the SEC sues everything else. Classic case of 'nobody got fired for buying Bitcoin'—even if it bores hedge funds to tears.
Funny how decentralized finance still dances to Bitcoin's tune. Maybe next bull run will be different... or maybe we'll just rerun this script again with higher numbers.

- Bitcoin faces key resistance near $118K, with $119.7K needed for a trend reversal.
- Strong accumulation zone identified between $112K and $114K amid rising trading volume.
- Altcoins lag behind as Bitcoin dominance continues, as the Altcoin Season Index drops to 36.
Bitcoin traders are following key resistance and support levels during range-bound price action. Recent market analysis points to ongoing consolidation, with Bitcoin (BTC) currently facing major resistance around the $117,000 to $118,000 range. Failure to break through this zone continues to fuel bearish pressure, suggesting that bulls must reclaim the key area around $119,700 to signal a possible short-term trend reversal.
The current price action has bitcoin trading near $114,177.53, marking a minor decrease of 0.26% over the past day. Despite this dip, trading volume has increased by 2.78% to $58.09 billion, showing heightened trader participation during this period of consolidation. The cryptocurrency’s market cap currently stands at $2.27 trillion, recording a decline of 0.25%.
Technical Indicators Highlight Accumulation Zone
Analysts’ technical charts show a high accumulation range between $112,000 and $114,000. Based on the current liquidity flows, this area is considered a good one. Traders believe that any declines into this range offer a good trading opportunity to those looking to accumulate positions and anticipate potential upside impetus should support levels be re-established.
This could become interesting as #Bitcoin has made a higher low.
Testing the resistance at $115K is usually a sign that we're going to break into the range and the #Altcoins to go up again.
Losing $113K –> new lows. pic.twitter.com/DnVS4UfzGG
Moreover, recent volume indicators show a large increase in trading activity NEAR recent price lows. The Relative Strength Index (RSI) is also currently neutral, neither indicating an overbought nor oversold condition. This neutrality suggests that Bitcoin’s price could move in either direction depending on market developments in the coming days.
Bitcoin’s circulating supply stands at approximately 19.9 million BTC out of a maximum total of 21 million. Its fully Diluted Valuation (FDV) is around $2.39 trillion, with a volume-to-market cap ratio of 2.55%, reflecting moderate liquidity in relation to the size of the market.
Altcoin Market Lags Behind Bitcoin
The Altcoin Season Index, which gauges the sentiment of the entire crypto market, is at 36 on a scale of 100. This shows a Bitcoin market environment in which its performance still dominates the altcoins. Historical trend indicates the index moving within the Bitcoin-dominant range during the past few months since it peaked in early December 2024 but as briefly as 87.
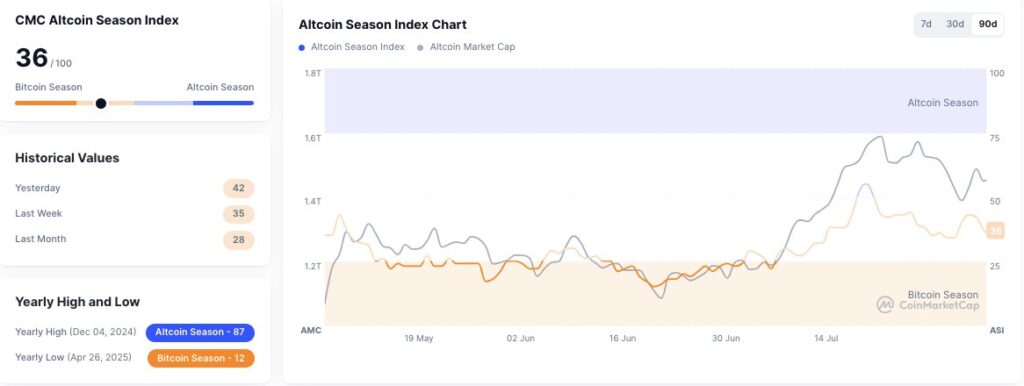
Over the past 90 days, altcoin market capitalization experienced a minor increase towards the last week of June and the first week of July, reflecting the changing altcoin sentiment. Recent weeks have, however, experienced some cooling off, with little in the way of gains recorded by altcoins compared to relatively stable Bitcoin growth.
