Ethereum Soars to New Yearly Peak, Leaves Solana in the Dust with Stellar Daily Performance
Ethereum isn't just climbing—it's mooning. The crypto giant just smashed another yearly high, flexing its dominance while Solana scrambles to keep up.
Who needs 'Ethereum killers' when ETH itself is on a tear? The network's latest surge isn't just a win—it's a brutal reminder of who still rules DeFi's playground. Meanwhile, SOL traders are left staring at charts, wondering when their 'next big thing' narrative will actually deliver.
Here's the kicker: Wall Street's still busy overcomplicating tokenized bananas while real assets print gains. Classic finance.

- Ethereum outperforms Solana with a 2.78% daily gain, hitting a new yearly high.
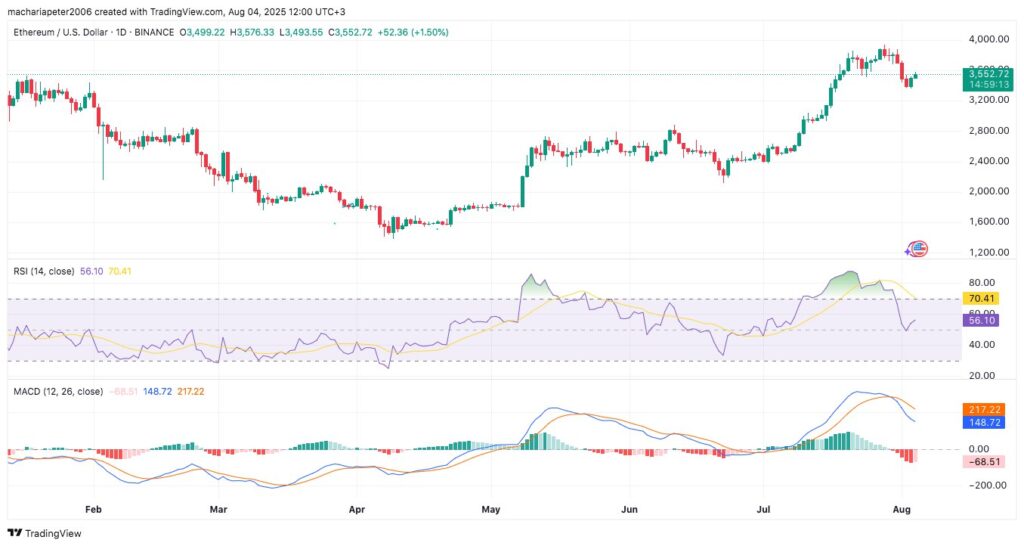
- RSI rebounds to 56.10, indicating decreasing sell pressure and room for higher prices.
- MACD shows bearish momentum, but narrowing gap indicates a possible bullish reversal.
Ethereum has reached a new yearly high, continuing its recent trend of outperforming other Layer 1 assets. crypto market analyst Nic (@nicrypto) commented on the move, noting ETH’s consistent strength over Solana in the latest rally.
ETH continues to outperform SOL.
Another yearly high.
Where does this top out? pic.twitter.com/I5irfBSyqf
During the time of writing, ethereum was trading at $3,556.45, marking a 2.78% daily gain. Its market capitalization rose to $429.29 billion, recording a 2.77% increase. In comparison, Solana recorded a small daily gain of approximately 1.50%, unable to match Ethereum’s pace. A comparative chart shows Ethereum rising from late August 3, while Solana remained flat until showing minor movement later.

Besides the gains recorded by ETH, another Ethereum-based altcoin is performing well. The token increased in value to over $21.70 after being under $12 in early May. The daily chart price action line indicates a bias of higher highs and higher lows, bespeaking persistent bullishness.
Despite Ethereum’s strong price action, its 24-hour trading volume fell 21.16% to $21.77 billion. The volume-to-market cap ratio now stands at 5.3%. Ethereum’s circulating supply holds at 120.7 million ETH, and with no fixed maximum cap, its fully diluted valuation is nearly identical to its current market cap.
Ethereum Momentum Indicators Show Possible Rebound
Technical indicators shows that Ethereum present reversal of pullback could be finding a base. The RSI indicator stands at 56.10 which recovered after dropping into the neutral 50 level this week. The RSI reached a high of 70.41 as it surged to the $4,000 indicating that it was overbought.

Furthermore, the MACD shows a more conservative picture. The MACD line is at 148.72, which is below the signal line, 217.22. The bearish momentum continues to be in place as indicated by the negative histogram of -68.51. Nevertheless, the reduced gap between the MACD and signal lines could indicate a change in the trend if the price level remains above the support of $3,500.

