Ethereum Defies Volatility: Strong $3.4K Support Sets Stage for Next Rally

Ethereum's price action just gave traders a masterclass in resilience—holding firm at $3.4K while lesser assets flail. Analysts see this as the calm before the storm, with consolidation paving the way for the next leg up.
Why this matters: The smart money knows sideways action isn't stagnation—it's accumulation. While traditional markets play musical chairs with interest rates, ETH's technicals whisper 'ascending triangle' to anyone who bothers to listen.
The kicker? Wall Street's still trying to explain how an 'experimental internet money' became the backbone of decentralized finance while their precious bonds yield less than a high-yield savings account. The future's here—it's just unevenly distributed.

- ETH holds above key support amid reduced volume and ongoing volatility.
- Analyst sees $3.2K–$3.4K as a key bounce zone before a possible $4K target.
- RSI and MACD confirm cooling momentum, suggesting short-term consolidation.
Ethereum (ETH) has maintained its position above support levels following a decline from late July highs, as market participants track key price zones and technical signals for the next move. At the time of writing, ETH traded at $3,493.37, recording a 2.94% daily increase after a period of high volatility and daily recovery.
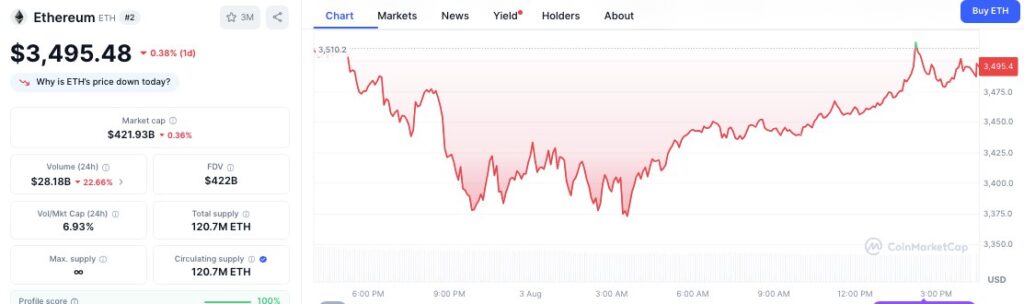
Source: CoinMarketCap
ETH’s market capitalization stands at $421.93 billion, a 0.36% decrease. Meanwhile, 24-hour trading volume decreased by 22.66% to $28.18 billion, showing a reduction in trading intensity. The volume-to-market cap ratio is 6.93%.
However, despite its price increase over the last 24 hours, market analyst Michaël van de Poppe stated that a 15% drop from recent highs could create a positive environment for accumulation, with the possibility of a reversal if these lower levels are reached. Van de Poppe projected that, if momentum turns, the next upside target could rise above $4,000.
A technical chart shared by CryptoInsMR identified two zones with a strong probability of bullish re-entry. The range between $3,200 and $3,400 was noted as an area with a 70% chance of allowing a price bounce based on prior volume support and past consolidation. A secondary support zone, between $2,950 and $3,100, was described as a deeper entry point with a 30% possibility of being reached if broader market risks persist.

Source: X
Ethereum Recent Trading Action and Market Metrics
Ethereum’s price action from early July to August included a sudden gain, followed by a decline from a peak NEAR $3,950. During this correction, the Relative Strength Index (RSI) displayed a bearish trend, as the asset reached higher price highs but lower RSI readings. The RSI has since remained at 53.63, recovering from a previous low after falling from the overbought zone of 72.64.
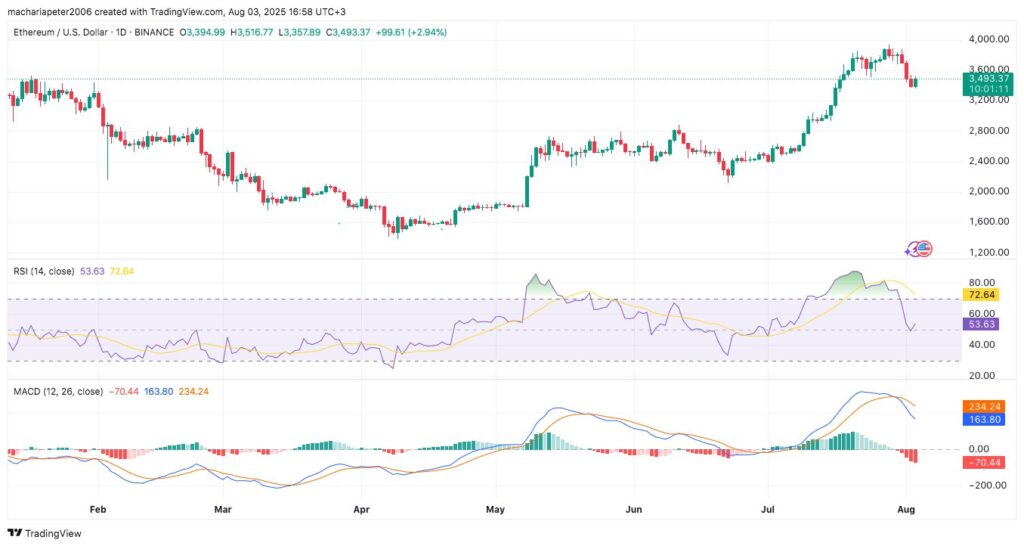
Source: TradingView
The MACD indicator also indicates a declining mood. At the last session, the MACD line stayed at 163.80, under the signal line (234.24), indicating a histogram reading of -70.44.
