Litecoin’s Bullish Surge: Ascending Channel Signals $140 Breakout as Analysts Predict New Rally

Litecoin's chart is painting a bullish masterpiece—and traders are scrambling to front-run the momentum.
The technical setup:
A textbook ascending channel has formed, with LTC consistently printing higher lows since its last consolidation phase. The pattern suggests institutional accumulation disguised as retail FOMO.
Price target in play:
Analysts are eyeing $140 as the next psychological resistance level. That’s a 30% climb from current levels—enough to make Bitcoin maximalists briefly glance away from their laser-eyed charts.
Market sentiment:
While ‘crypto analysts’ sharpen their Twitter threads with moon emojis, the real action is in the derivatives market. Open interest is creeping up—though whether this fuels the rally or becomes cannon fodder for whale-sized liquidations remains to be seen.
The cynical footnote:
Nothing rallies harder than an altcoin that Wall Street hasn’t yet figured out how to short with ETFs.

Litecoin (LTC) is experiencing dynamic price action recently, displaying signs of bullish momentum.
Today, market analyst Ali Martinez confirmed the upturn MOVE and disclosed bullish targets for the asset in the short and medium term.
Litecoin $LTC holding above the channel’s mid-level at $100 could pave the way for a rally toward the upper boundary at $140. pic.twitter.com/hT5qOI20wV
— Ali (@ali_charts) July 13, 2025Litecoin Moving Inside Ascending Channel
As illustrated in Ali’s data, LTC is moving in an optimistic technical environment as it continues to trade in a clear ascending channel on the weekly timeframe.
This bullish structure has kept LTC price action under pressure, with every attempt at recovery meeting resistance along the middle trendline. The pattern indicates a wider struggle between bulls trying to defend significant support regions and bears maintaining a strong hold on short-term movements.
As Litecoin’s price moves tighter within the range of this channel, this signifies that a decisive move could be imminent. According to Ali, holding above the channel’s mid-level at $100 could set a ground for an uptrend toward the upper boundary at $140.
As per the data, the $100 price mark seems to be a crucial support region, and maintaining it WOULD signify a looming upward movement. Continued trading above the $100 suggests an upcoming upturn move.
LTC is indicating signs of a potential bullish move after experiencing strong support NEAR the middle trendline of the ascending channel on the weekly chart. This middle trendline has acted as a strong support, backing recent bullish attempts and reinforcing the overall uptrend structure.
LTC Price Actions Show Bulls Comeback
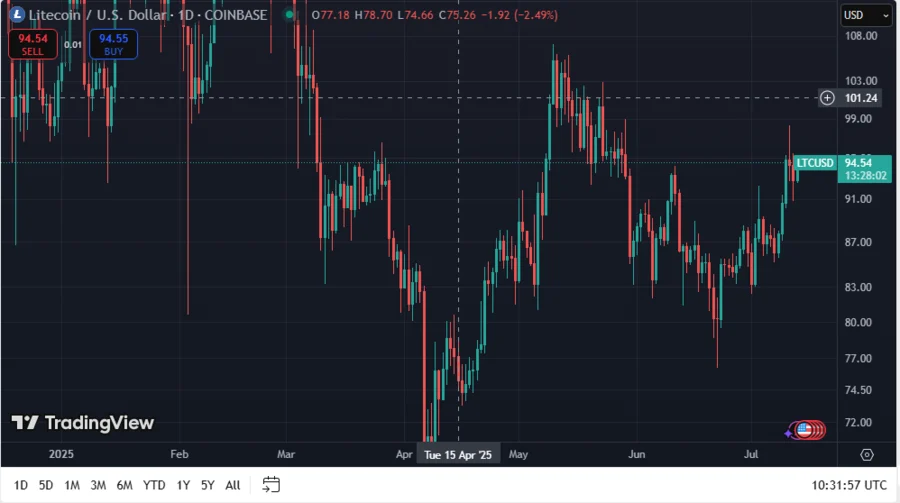
LTC’s value is currently hovering at $94.37, up 1.2% over the past 24 hours. Its price has also been up 8.4%, 8.7%, and 12.9% over the past seven days, two weeks, and one month, respectively, showing the bullish momentum is present and remains intact.
The formation of the bullish flag pattern (as pointed out by Ali) suggests the price is stabilizing and getting ready for another uptrend.
With its recent strong market performance, LTC is expected to continue surging towards the $107.05 and $110.60 resistance marks, which are both the TP1 (Take Profit 1) and the upper boundary of the current middle trendline. These marks also align with the upper border of the buyer zone, making them natural targets for the next movement.
With the asset’s price holding above crucial support and confirming the ascending channel pattern, the token remains bullish and expects a continued move upward toward $110 and beyond.
