Altcoins at Critical Juncture: 2025 Support Retest Mirrors 2016–2017 Bull Run Setup

Deja vu in crypto land as altcoin charts replay their pre-boom blueprint.
Key support levels are getting stress-tested this week—and traders are getting that 2017 déjà vu. The same fractal patterns that preceded last cycle's 12,000% altcoin explosion are flashing again. Only this time, Wall Street's 'risk managers' are too busy chasing AI stocks to notice.
Breakdown or springboard?
Market structure doesn't lie. When Bitcoin dominance wobbles like this in July, history shows alts are primed to run. The 2016-2017 playbook saw 18 months of altcoin mania after similar technicals. But today's 'sophisticated' investors still think Dogecoin is a meme.
Watch the weekly closes. Hold these levels, and we're looking at Q4 fuel for the next speculative frenzy. Lose them? Even your Uber driver will stop giving you shitcoin tips.

- Altcoin market repeats 2016–2017 structure, signaling possible breakout phase ahead.
- Second retest of 2018 level mirrors past cycle, confirming strong support formation.
- Chart patterns align across timeframes, hinting at start of a new expansion cycle.
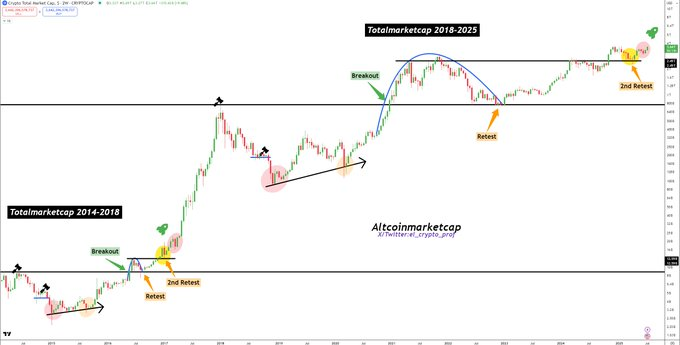
The altcoin market is showing signs of repeating a historical cycle structure that previously led to a major breakout phase. Based on chart data tracking total altcoin market capitalization from 2014 to 2025, the current formation closely mirrors the patterns recorded in the 2016–2017 period, with analysts identifying key breakout and retest phases now aligning with previous cycles.
#Altcoins
Really think that this is the start of something big.![]()
Totalmarketcap repeats the structure of 2016/2017, only in a larger timeframe.
As soon as we take out the ATH's from Dec. 2024, we're at the point of spring/summer 2017 where altcoins went absolutely wild. pic.twitter.com/7ynQ78OZ4k
![]()
Chart observations from the 2018–2025 timeframe show that the market broke above the previous cycle high and later returned to retest that level. A second retest followed, establishing a similar structure to the 2014–2018 period. In that earlier cycle, the market experienced a breakout, a retracement, and a secondary retest before entering a strong upward trajectory.
According to the chart labeled “Altcoin Marketcap,” the current consolidation follows a completed retest of the 2018 resistance-turned-support level. The price structure remains consistent with earlier bullish cycles. Market analysts have noted the presence of a green arrow on the latest segment of the chart, indicating a possible upward shift in momentum.
Market Structure Suggests Upcoming Expansion Phase
The historical pattern reflected in the chart shows a sequence of expansion, correction, and accumulation. The repeat of this sequence, especially the recent second retest, positions the market structurally at a point comparable to early 2017. During that period, altcoin prices accelerated sharply following similar conditions.
As of mid-2025, the chart suggests the altcoin market is approaching the final stage of consolidation before a possible breakout. The previous all-time high from December 2024 remains a key resistance level. A MOVE beyond that level could confirm a trend continuation, similar to the breakout that occurred in spring 2017.
Technical Alignments Across Timeframes
The repeated pattern in the market over an extended period is evidence to support the succession of the cyclical trend. According to chart analysts, structural similarities throughout long-term cycles do not occur in isolation but FORM broader patterns.
The recurring nature of market structure and technical confirmations in the altcoin market is considered to be one of the essential indicators. Since the second retest was already valid, the motif corresponds to previous breakouts. In case the pattern is non-deceptive, market participants have a chance of witnessing the onset of a new expansion cycle, with resistance clearance awaiting confirmation.
