Bitcoin Soars 10% in July—Defying Gravity Above $118K as Traders Cheer

Bitcoin just moonwalked past another resistance level—laughing at bears as it clocks a double-digit July rally.
The $118K fortress holds
No pullbacks, no panic—just relentless upward momentum. The king of crypto isn’t just surviving macro turbulence; it’s thriving while traditional finance clutches its pearls over 'volatility.' (Funny how 10% gains are 'risky' when Wall Street isn’t pocketing the profits.)
What’s fueling the surge?
Institutional FOMO? ETF inflows? Or just the market finally realizing fiat is a slow-motion trainwreck? Whatever the catalyst, Bitcoin’s playing chess while altcoins struggle with checkers.
One thing’s clear: When BTC flexes like this, the whole ecosystem feels the ripple. Buckle up—this ride’s just getting started.
- Bitcoin gains 10.24% in July 2025, continuing its strong historical trend for the month.
- BTC holds above $118K despite intraday swings, showing market stability amid lower volume.
- July ranks as one of Bitcoin’s most reliable months, with positive returns in 71% of years.
Bitcoin has continued its upward trend in July 2025, recording a 10.24% gain so far this month and trading above the $118,000 mark. Despite early-year corrections, the cryptocurrency has followed its historical seasonal trend, with July often serving as a rebound month for price action.
Data covering Bitcoin’s monthly returns from 2012 to 2025 indicates that July is one of the most consistent months for gains. Out of the past 14 years, 10 have ended with positive returns during July, translating to a 71% success rate. The best-performing July occurred in 2012, when Bitcoin climbed 41.03%. Other monthly gains include 24.67% in 2018, 21.1% in 2020, 23.34% in 2021, and 21.42% in 2022.
According to history from 2012–2025, July is among the most reliable months for bitcoin growth: in 10 out of 14 cases (71%) it showed positive returns.
However, October demonstrates the highest reliability where the percentage of "positive" months reaches 77%. pic.twitter.com/AxBSAggDJl
![]()
![]()
This year’s performance continues that pattern. After a strong January, when Bitcoin ROSE 10.88%, the asset saw declines in February and March, falling 19.55% and 3.15%, respectively. A reversal began in April with a 12.5% rise, followed by gains of 8.65% in May and 2.99% in June.
While July shows high reliability, October holds the highest percentage of positive monthly closes for Bitcoin, with gains recorded in 77% of cases. Still, July’s track record remains one of the most consistent across Bitcoin’s history.
Intraday Volatility Within Stable Range
During the time of writing, Bitcoin was trading at $118,015.99, down 0.17% over the past 24 hours. Despite the dip, Bitcoin price has remained above $118,000 for most of the day. Data shows Bitcoin ranged between $116,500 and $118,200 during recent trading, with a dip followed by recovery toward the $118,000 level.
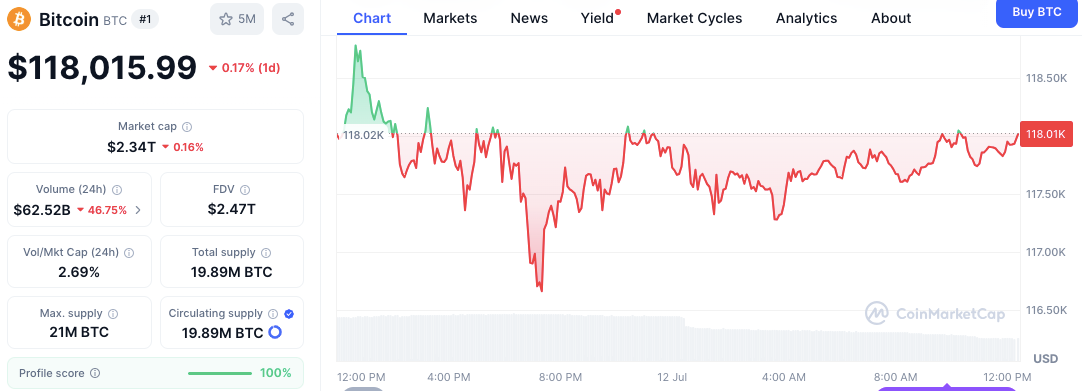
The market value is currently at 2.34 trillion. The 24-hour trading volume of Bitcoin has reduced by 46.75 percent to 62.52 billion dollars, indicating reduced pace. The total number of BTC in circulation stands at 19.89 million, with only 21 million maximum available.
The ratio between volume and market capitalization is 2.69 % indicating that small trading is taking place. As the weekend trading approaches, the question now is whether Bitcoin will be able to break its recent highs or continue to remain within the range into the second half of the month.
