Daily Market Review: BTC, ETH, FARTCOIN, EOS, VET


The bulls are in total control of today’s session, as seen from the increase in the global market cap. The total cap stood at $3.55T as of press time, representing a 2.47% increase over the last 24 hours, while the trading volume jumped by 5.8% over the same period to stand at $164.57B as of press time
Bitcoin Price Review
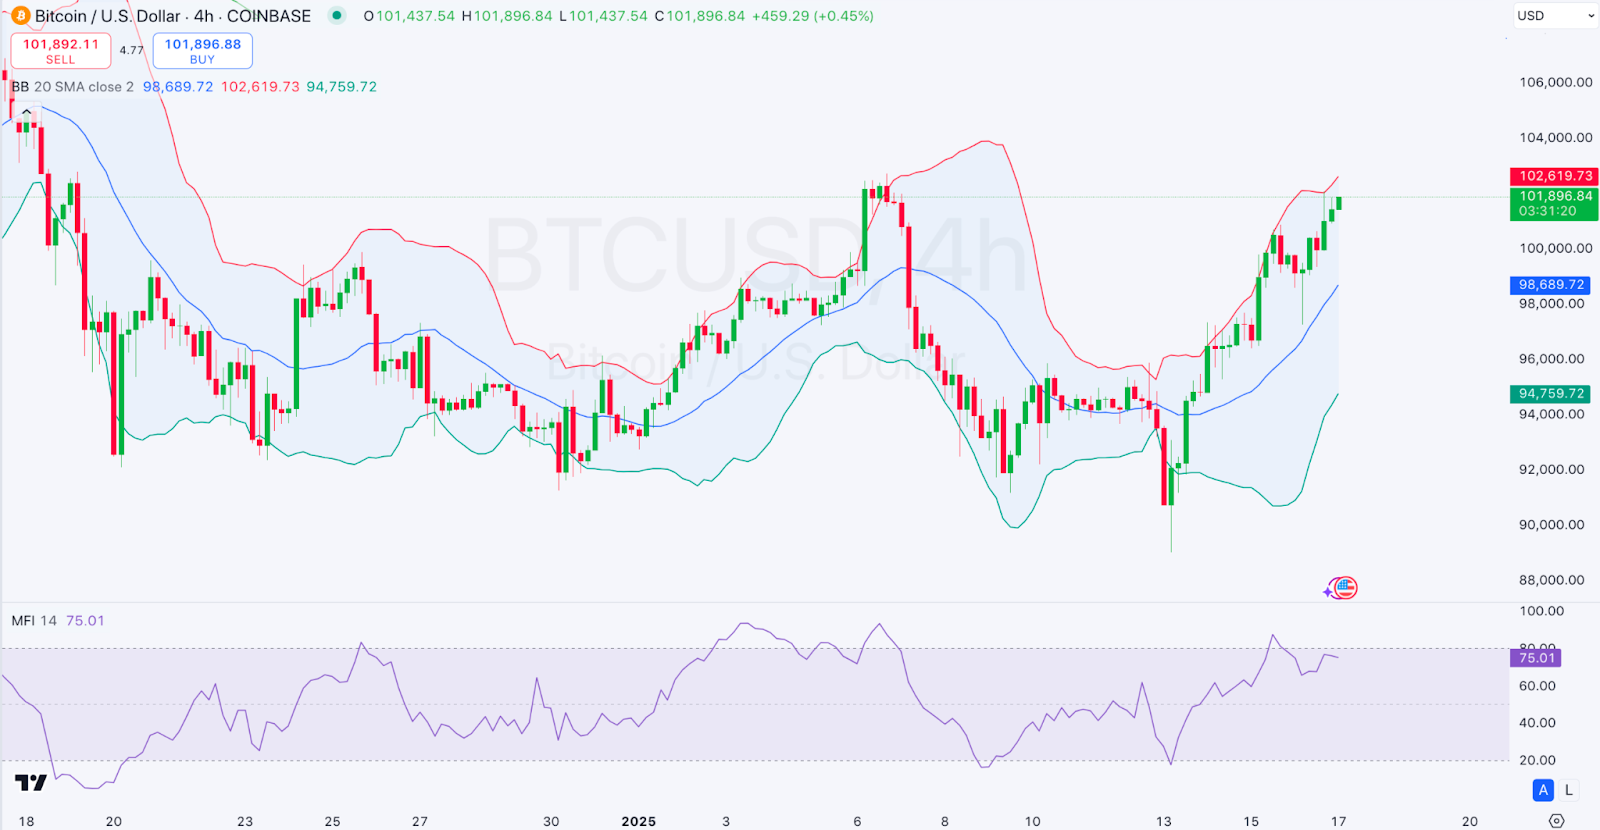
Bitcoin, $BTC, posted a notable increase in today’s session, as seen from its price movements. Looking at an in-depth analysis, we see that the Bitcoin price is trading near the upper band, signaling that the asset might be overbought, or it could be in a strong bullish trend if the price stays above the middle band (blue).
On the other hand, we see that the Money Flow Index (MFI)is at 75.01, the MFI is approaching overbought territory, which indicates high buying activity. A pullback could occur if the MFI crosses above 80, but for now, the momentum remains bullish. Bitcoin traded at $102,102 as of press time, representing a 3.18% increase over the last 24 hours.
Ethereum Price Review
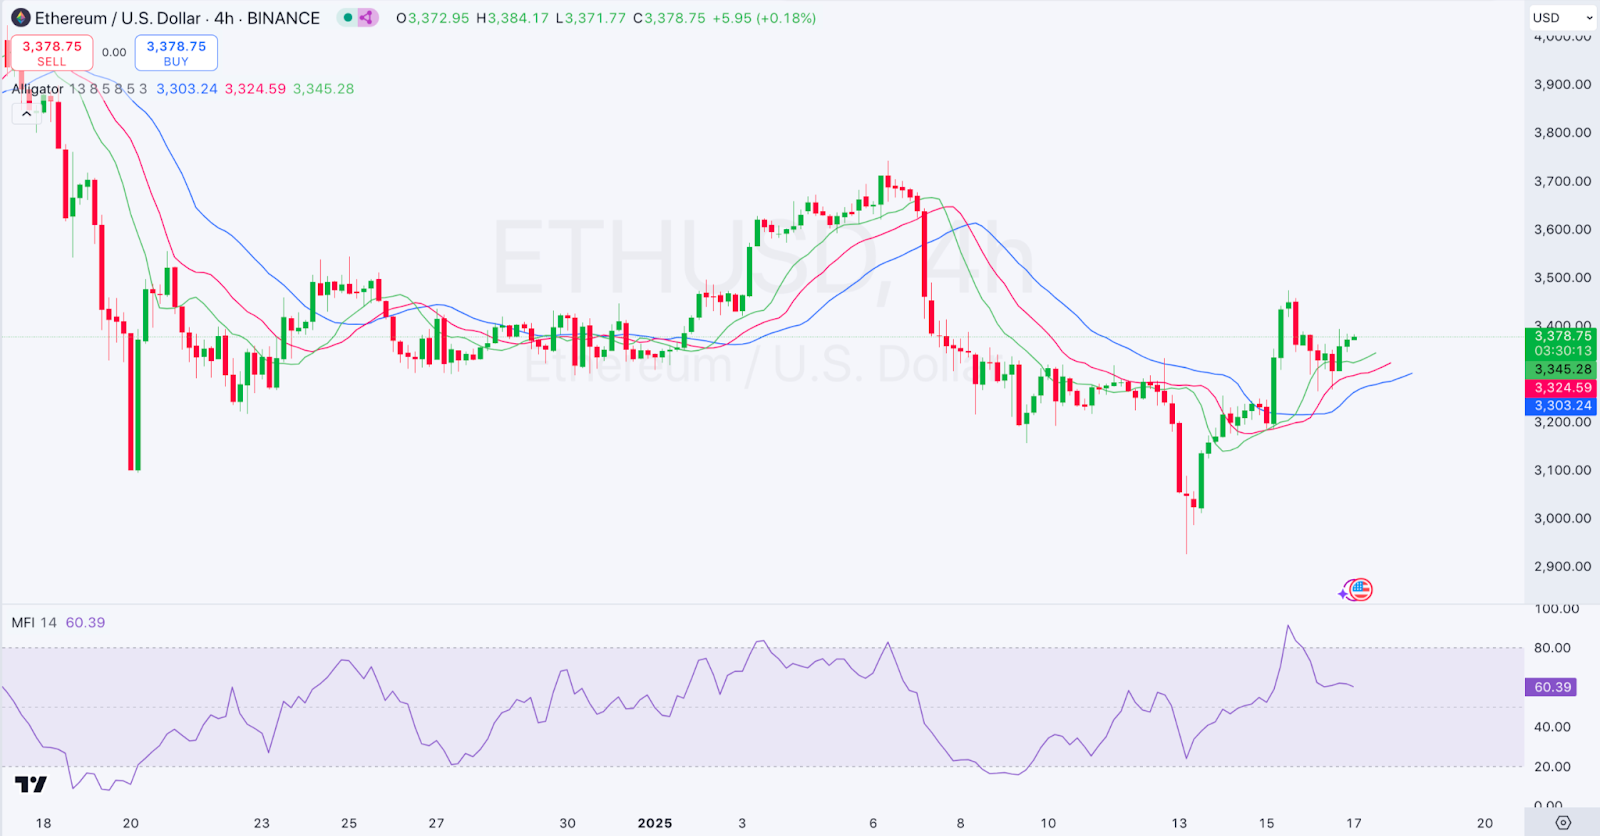
Ethereum, $ETH, is also among the gainers in today’s session as seen from its price movements. Looking at an in-depth analysis, we see that the green line (smooth) is crossing above the blue and red lines, which typically indicates a buy signal. The indicator suggests that Ethereum might be preparing for a bullish breakout.
On the other hand, we see that the Money Flow Index (MFI): The MFI is at 60.39, implying neutral market conditions. There’s room for more buying or selling depending on future price movements. Ethereum traded at $3,409 as of press time, representing a 2.69% increase over the last 24 hours.
Fartcoin Price Review
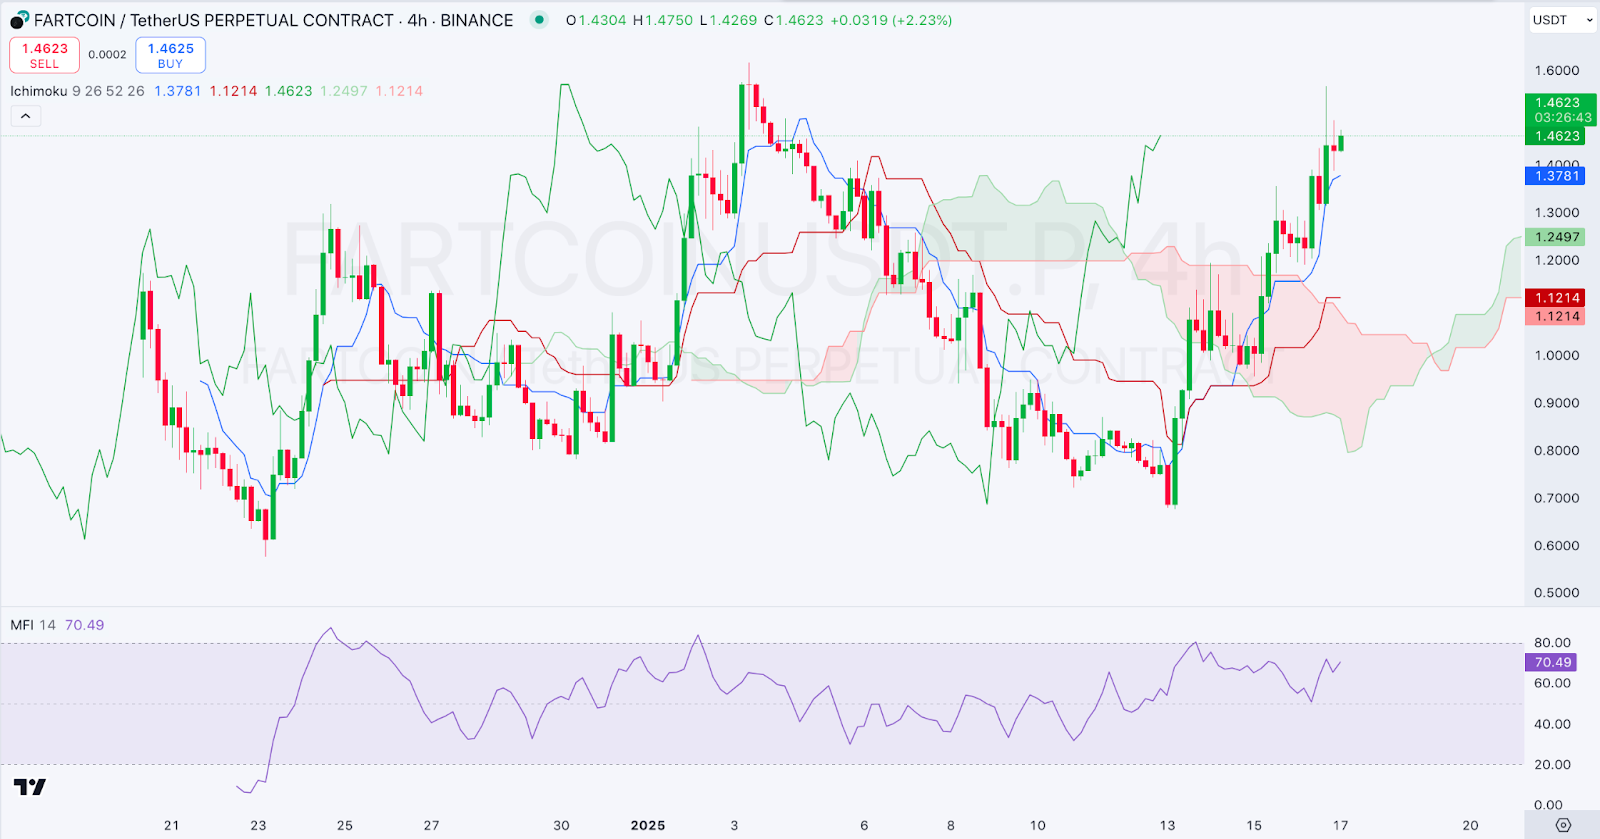
Fartcoin, $FARTCOIN, is among the day’s top gainers as seen from its price movements. Looking at an in-depth analysis, we see that the Fartcoin price is above the cloud, which is a bullish sign. The blue line (Tenkan-sen) crossing above the red line (Kijun-sen) is also a bullish signal. The green area above the cloud suggests that the bullish trend is likely to continue.
On the other hand, we see that the Money Flow Index (MFI): The MFI is at 70.49, indicating the market is nearing overbought conditions. A retracement might happen if the MFI surpasses 80. Fartcoin traded at $1.45 as of press time, representing a 18.85% increase over the last 24 hours.
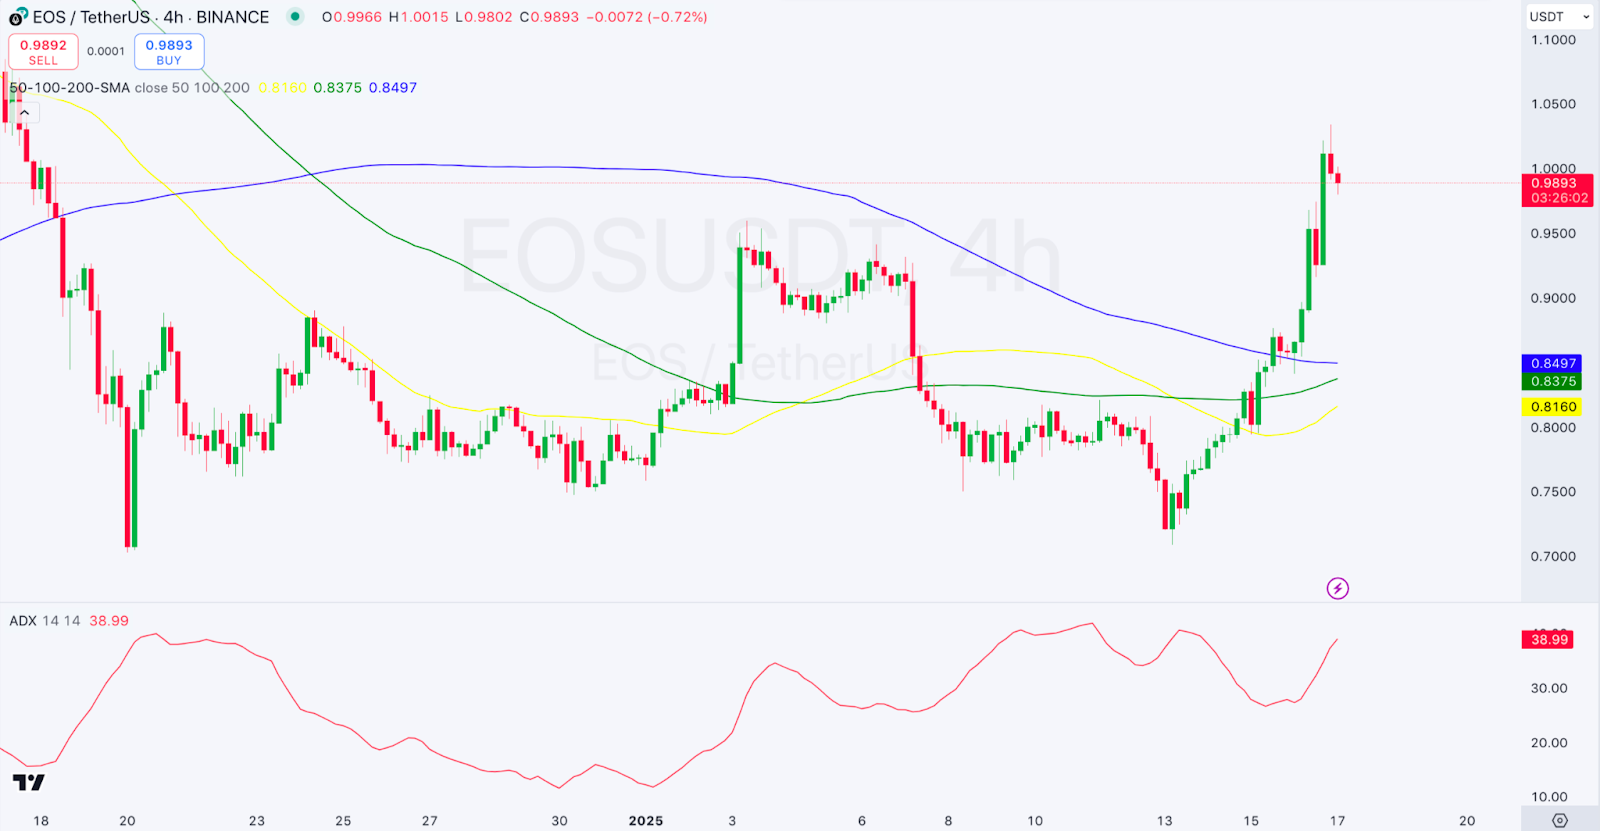
EOS Price Review
EOS, $EOS, is also among the gainers in today’s session as also seen from its price movements. Looking at an in-depth analysis, we see that the EOS price crossing above the 50-SMA is a short-term bullish sign, while the price is still below the 100 and 200 SMAs, signaling that a trend reversal is not yet confirmed.
On the other hand, we see that the Average Directional Index (ADX) is at 38.99, indicating that the trend strength is strong, and a trend continuation could be expected. It’s important to watch if the price holds above the 50-SMA for confirmation of further bullishness. EOS traded at $0.9852 as of press time, representing a 16.54% increase over the last 24 hours.
VeChain Price Review
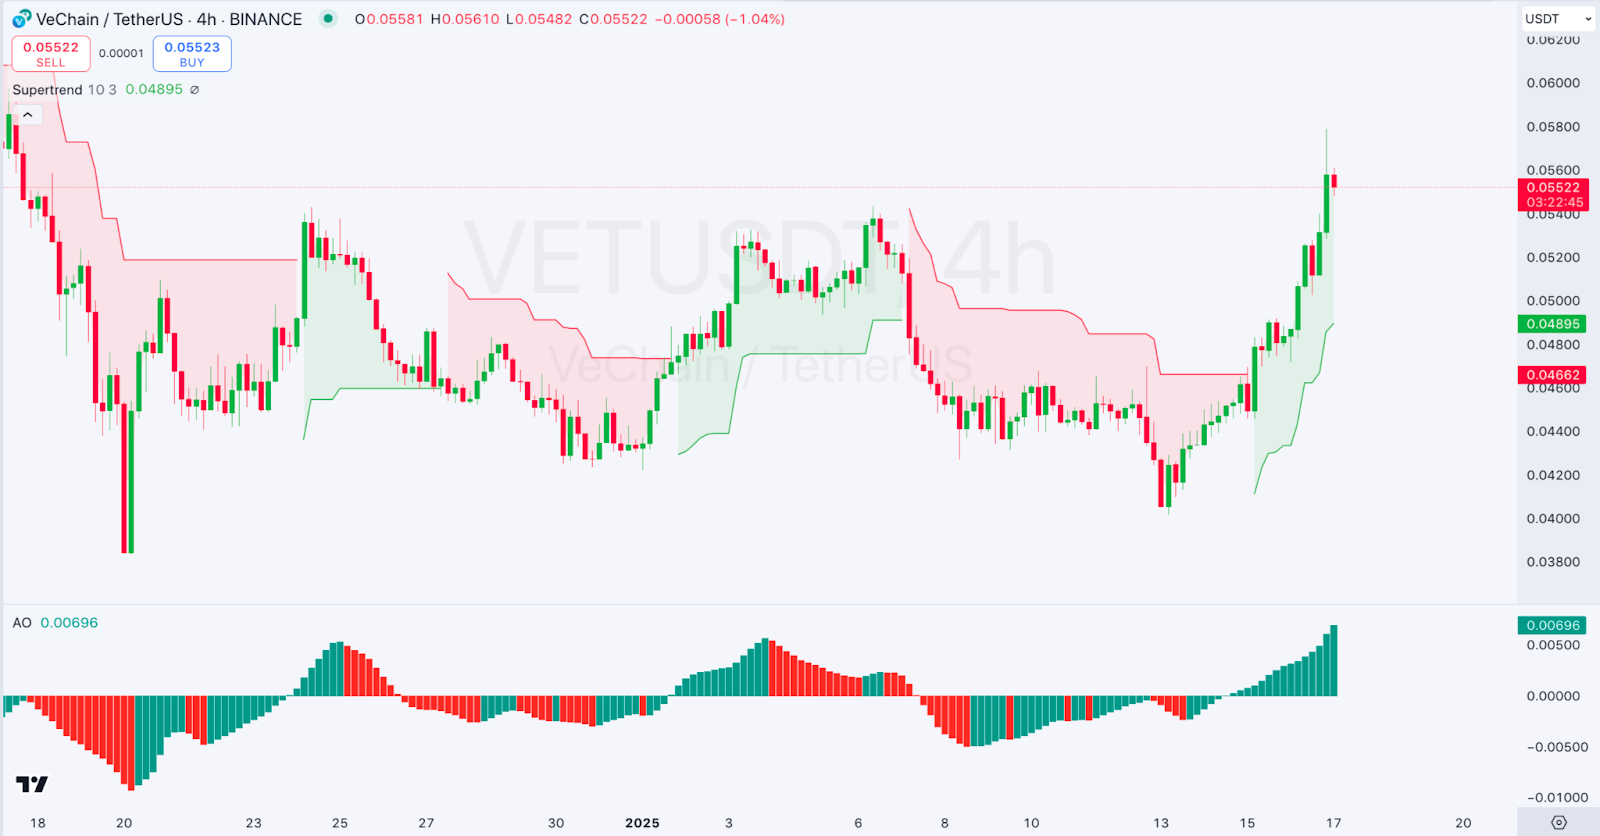
VeChain, $VET, is also among the top gainers as also seen from its price movements. Looking at an in-depth analysis, we see that the VeChain price is above the supertrend’s green line, signaling bullish momentum. This suggests that VeChain is in an uptrend, but there is potential for a reversal if the price falls below the supertrend.
On the other hand, we see that the Awesome Oscillator (AO) is positive, indicating that buying pressure is strong. A sudden increase in the AO might confirm further bullish continuation. VeChain traded at $0.05527 as of press time, representing a 16.88% increase over the last 24 hours.