Bitcoin Overtakes Google: Now the Sixth Largest Asset Globally by Market Cap

In a seismic shift for digital assets, Bitcoin has surged past tech giant Google in market capitalization—claiming the #6 spot worldwide. The cryptocurrency now sits comfortably between silver and Tesla in the global rankings.
Wall Street analysts are scrambling to update their models while traditional finance pundits insist it''s "just a bubble." Meanwhile, crypto traders are already pricing in Bitcoin flipping Apple by 2026—because why let reality interfere with a good narrative?
This milestone comes as institutional adoption hits record levels, with BlackRock''s Bitcoin ETF seeing 47 consecutive days of inflows. The asset that was supposed to die in 2018 just keeps resurrecting—much to the dismay of banking lobbyists.
Fun fact: Bitcoin''s market cap now exceeds the GDP of Switzerland. Not bad for "magic internet money" that still can''t buy you a Starbucks latte directly.

- Bitcoin has overtaken Google to become the sixth-largest global asset by market cap.
- It is trading at $109,167, just 2.3% below its all-time high of $111,970.
- Traders are watching the $107K–$111K range closely as volatility builds and short positions pile up.
Bitcoin has officially passed Alphabet (Google) in the asset rankings and occupies 6th place in market capitalization. Bitcoin’s market cap at present now sits at $2.169 trillion, just slightly ahead of Google at $2.145 trillion on the latest chart. The move also places Bitcoin behind Amazon, Apple, NVIDIA, Microsoft, and gold as one of the world’s most valuable assets.
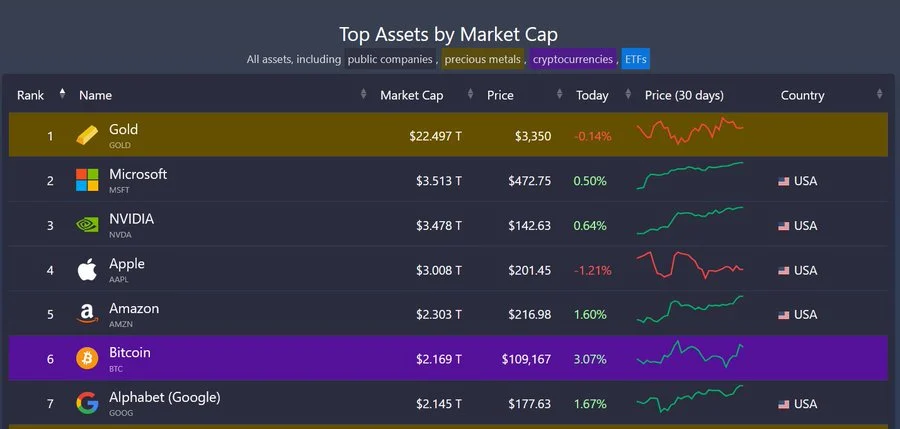
Bitcoin is the biggest top asset in daily gains today, up 3.07% to currently trade at $109,167. The upward momentum also brings it closer to an all-time high of $111,970, cementing its position as a dominant player among tech and traditional financial giants. bitcoin and Amazon were among the top seven, putting up 1.5% and more gains on the day.
This trend is also clearly visible in the market chart, while legacy tech stocks like Apple went down 1.21%, gold did not move either way, and Bitcoin shone in the short run, meaning an increasing appetite for alternative stores of value.
BTC Eyes Breakout Despite Cautious Sentiment
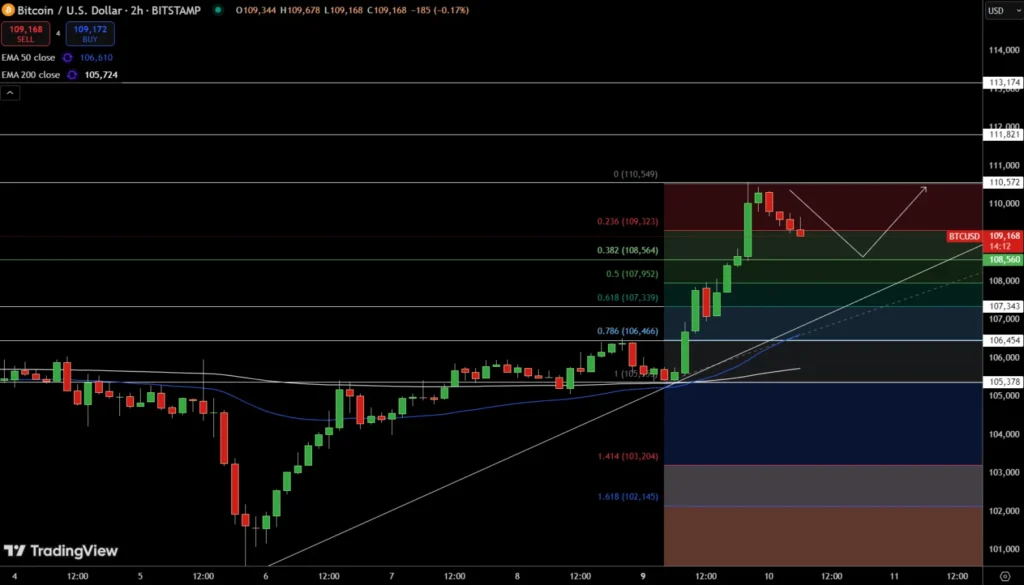
Bitcoin’s recent spike kicked off a fresh round of speculation on a possible breakout. The price bounced up from $105,378 to $110,549 in the form of a classic bullish “Three WHITE Soldiers” on the chart. The price has stalled on technical resistance at the 0.236 Fibonacci level at around $109,323.
Bitfinex analysts are cautious. Their report states that Bitcoin is unlikely to have a strong macro catalyst, which makes a pullback more likely. Without structural momentum, it will be problematic for BTC to break its all-time high without being provoked by external factors like the June 18 Fed meeting or updates to U.S. trade policy.
However, the technical setup is positive despite the hesitation. However, Bitcoin is trading above both the 50 and 200-day EMAs at $106,610 and $105,724 respectively. Key support lies between the 0.5 and 0.618 Fib retracement levels at $107,339 and $107,952 as well as an ascending trendline.
$1.08B in Shorts at Risk if Resistance Breaks
Market pressure is intensifying from the derivatives side. Short positions worth $1.08 billion are currently exposed, based on CoinGlass data. A short squeeze could drive further upside if Bitcoin breaches the resistance zone convincingly. Such liquidations often lead to rapid price expansion but also heighten volatility.
Traders watching the $107.3K–$108K range may find opportunities. A dip into this zone could trigger bullish setups like hammers or engulfing candles. Rebounds from these levels could push the price back toward $110,549 or higher. Still, risk management remains essential. A stop-loss below $106,466 could help limit the downside.
A spinning top candle recently formed on the daily chart, signaling indecision. Yet this does not confirm rejection, only a pause as bulls and bears wrestle for control. With current momentum holding, short-term moves will likely be determined by how the price interacts with this narrow band of support and resistance.
