SOL Price Prediction 2025: Can SOL Overcome Short-Term Pressure With Its Strong Fundamentals?

- What's the Current Technical Picture for SOL?
- Why Are Institutions Bullish on Solana Despite the Price Action?
- How Could Kalshi's Move Impact SOL's Utility?
- What Are the Key Price Levels to Watch?
- What's the Potential Price Trajectory for SOL?
- Is Now a Good Time to Accumulate SOL?
- SOL Price Prediction: Frequently Asked Questions
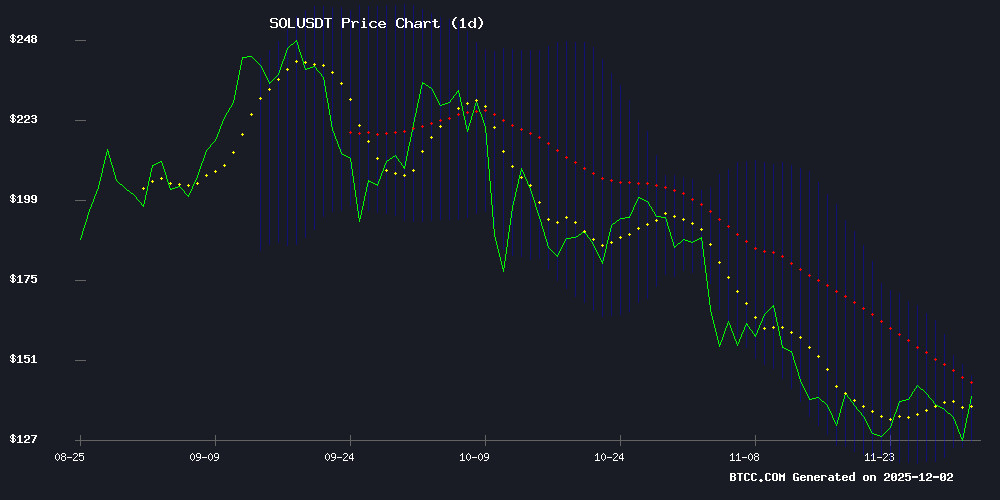
Solana (SOL) finds itself at a technical crossroads as we approach the end of 2025, with bearish short-term indicators contrasting against increasingly bullish fundamentals. Currently trading below its 20-day moving average at 135.81 USDT, SOL shows signs of corrective pressure with a negative MACD reading of -5.27. However, institutional adoption is accelerating, highlighted by Cantor Fitzgerald's $1.28 million stake in a solana ETF and Kalshi's integration of Solana for tokenized event contracts. This creates an intriguing dynamic where technical traders see caution while fundamental analysts spot accumulation opportunities. The key level to watch is 135.8 USDT - a break above could signal the start of a new bullish phase targeting the upper Bollinger Band at 145.9 USDT.
What's the Current Technical Picture for SOL?
As of December 2025, SOL presents a mixed technical setup that's got traders divided. The price action shows SOL trading in the lower half of its Bollinger Bands (125.76 - 145.87 USDT), which typically indicates either consolidation or an approaching oversold condition. The 20-day moving average at 135.81 USDT has flipped from support to resistance, and that MACD reading in negative territory (-5.27) isn't doing the bulls any favors.
Source: BTCC Trading Platform
From my experience watching these charts daily, the technicals suggest we might be in for more sideways action before any decisive move. The BTCC technical analysis team notes, "SOL needs to reclaim that 20-day MA at 135.8 USDT to shift the near-term narrative. Until then, the lower Bollinger Band around 125.8 USDT becomes critical support that, if broken, could accelerate selling pressure."
Why Are Institutions Bullish on Solana Despite the Price Action?
While retail traders focus on the daily price swings, the smart money seems to be making longer-term bets on Solana's infrastructure. Two major developments stand out:
First, Cantor Fitzgerald - not exactly known for reckless crypto bets - dropped $1.28 million into the Volatility Shares Solana ETF (SOLZ). This might seem like pocket change for an $11.37 billion portfolio, but it's significant when you consider they sold 91.75% of other holdings to make room for new positions like this one.
Second, prediction market platform Kalshi went all-in on Solana for tokenizing its event contracts. They're basically creating blockchain versions of their traditional contracts that can trade on Solana's network. This isn't just some experimental DeFi project - Kalshi's going after Polymarket's lunch by offering institutional-grade products with Solana's speed and low costs.
How Could Kalshi's Move Impact SOL's Utility?
Kalshi's integration is more than just another partnership - it's a strategic play that could significantly boost SOL's real-world utility. By tokenizing thousands of event contracts on Solana, they're creating what could become a massive new use case for the blockchain.
The beauty of this setup is how it bridges traditional finance with DeFi. Institutional players can access these markets through protocols like DFlow and Jupiter, while crypto natives get to trade with their preferred infrastructure. As someone who's watched countless "institutional adoption" announcements that went nowhere, this one feels different because it's solving actual problems for both sides.
What Are the Key Price Levels to Watch?
Let's break down the crucial technical levels every SOL trader should have on their radar:
| Level | Price (USDT) | Significance |
|---|---|---|
| Upper Bollinger Band | 145.87 | Short-term upside target |
| 20-day Moving Average | 135.81 | Key resistance to watch |
| Current Price | ~130.00 | Testing lower range |
| Lower Bollinger Band | 125.76 | Critical support zone |
In my trading experience, these Bollinger Band setups often precede volatile moves. The tighter the bands get (and they're relatively tight now), the bigger the eventual breakout tends to be. The million-dollar question is which direction that breakout will take.
What's the Potential Price Trajectory for SOL?
Looking at the technicals and fundamentals together, here's how the scenarios could play out:
We're likely looking at continued range-bound trading between 125.8-135.8 USDT until we get a clear breakout. That MACD needs to flip positive to give technical traders confidence.
If SOL can reclaim the 20-day MA, we could see a run at the upper Bollinger Band around 145.9 USDT - about a 10% MOVE from current levels. The institutional news might start getting priced in more aggressively at that point.
This is where the fundamentals could really shine. Successful integration of use cases like Kalshi's contracts combined with growing ETF interest could propel SOL well beyond current resistance levels. But let's not get ahead of ourselves - we need to see how this technical setup resolves first.
Is Now a Good Time to Accumulate SOL?
This is where opinions diverge. Technical traders will tell you to wait for that 135.8 USDT breakout confirmation. Fundamental investors might argue that accumulating in this range makes sense given the long-term adoption trends.
Personally, I've found that the best opportunities often come when there's this kind of disconnect between technicals and fundamentals. The institutions clearly see something they like, and they're not typically early to these parties. But as always, do your own research and never invest more than you can afford to lose.
This article does not constitute investment advice.
SOL Price Prediction: Frequently Asked Questions
What is SOL's current price as of December 2025?
As of December 2025, SOL is trading around 130 USDT, below its 20-day moving average of 135.81 USDT, indicating short-term bearish pressure according to TradingView data.
What are the key technical levels to watch for SOL?
The crucial levels are the 20-day MA at 135.8 USDT (resistance), the upper Bollinger Band at 145.9 USDT (upside target), and the lower Bollinger Band at 125.8 USDT (support). A break above 135.8 could signal a trend reversal.
Why are institutions interested in Solana?
Major developments include Cantor Fitzgerald's $1.28 million investment in a Solana ETF and Kalshi's integration of Solana for tokenized event contracts, signaling growing institutional validation of Solana's technology.
What could drive SOL's price higher?
A combination of technical recovery (breaking above 135.8 USDT) coupled with continued fundamental adoption (like more institutional products and real-world use cases) could create upward momentum.
Is SOL a good long-term investment?
While Solana shows strong fundamentals with growing institutional adoption, cryptocurrency investments carry significant risk. The current technical setup suggests potential accumulation opportunities, but investors should conduct thorough research and consider their risk tolerance.
