Bitcoin’s Bullish Run Hinges on Holding Above $114K — Here’s the Critical Reason

Bitcoin bulls dig in as $114K becomes the line in the sand.
The Momentum Threshold
Holding above $114,000 isn't just psychological—it's technical. That level represents the convergence of historical resistance and institutional accumulation zones. Break it, and you're looking at diminished selling pressure. Lose it, and even the most optimistic traders start sweating.
Market Mechanics at Play
Whales aren't dumping at these levels. Instead, they're accumulating on minor dips—classic bull market behavior. Retail FOMO hasn't even kicked in properly yet, which means there's dry powder waiting on the sidelines. The real fireworks start when mainstream media catches up to what chain analytics have been screaming for weeks.
Institutional Gravity
Corporate treasuries and ETF flows create a floor that didn't exist in previous cycles. They buy methodically, not emotionally—turning what would've been panic-selling events into buying opportunities. It's almost like traditional finance finally learned something from crypto, though they'll never admit it over their $50 coffees.
Patterns Don't Lie
Every higher low since the last correction points to one thing: strength. The market isn't just guessing—it's pricing in structural shifts that make previous all-time highs look quaint. Technicals suggest that holding $114K clears the path toward price discovery that'll make current levels look like a discount.
So while traditional fund managers still debate 'digital gold,' smart money already stacks—proving once again that innovation moves faster than legacy finance can complain about it.
Why $114,500 Is A Critical Support Area For Bitcoin Price
In a September 20th post on the X platform, crypto analyst Axel Adler Jr. shared an interesting on-chain perspective on the current setup of the Bitcoin price. According to the online pundit, the price of BTC is likely to resume its bull run so long as it remains above the $114,500 level.
This evaluation revolves around the Volume-Weighted Average Price (VWAP) band, which represents the average price of an asset (Bitcoin, in this scenario) weighted by its trading volume. The metric plots two upper and lower bands, which act as dynamic support and resistance levels for the asset’s price.
According to Adler Jr., the 14-day VWAP band is currently absorbing the selling pressure faced by the price of Bitcoin. This band lies around the $114,500, making the price level a significant support cushion for the market leader.
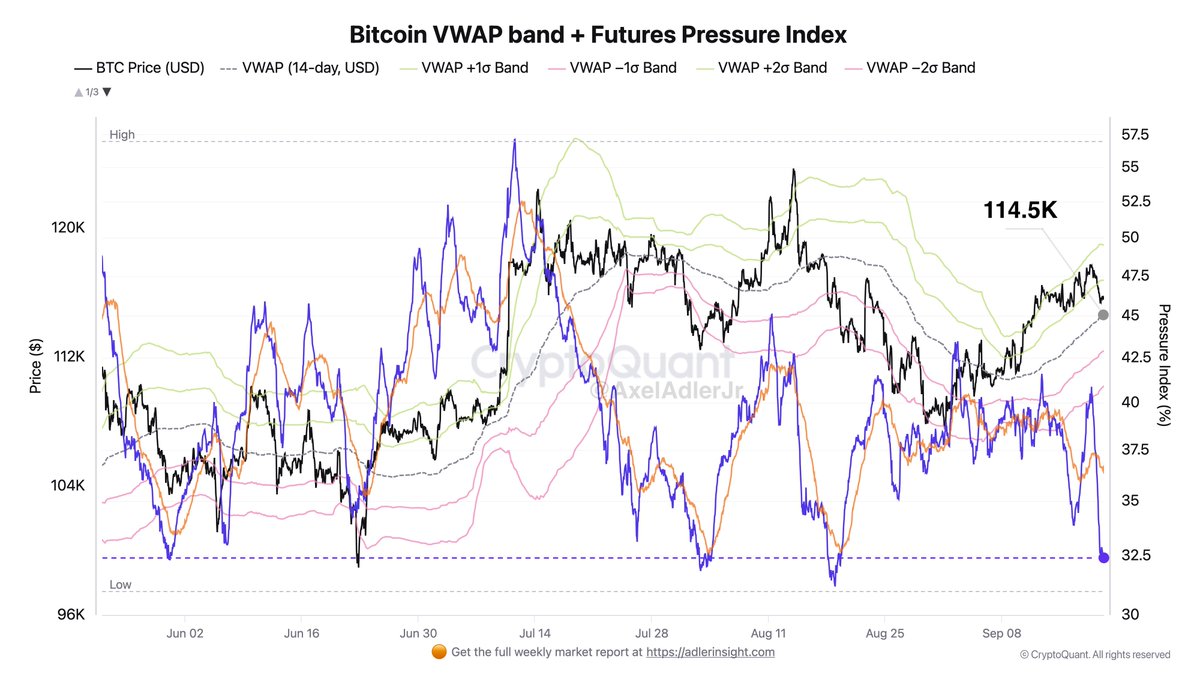
The on-chain analyst noted that, so long as price holds above this $114,500 region, the premier cryptocurrency is likely to retain its upside bias. “As long as price holds above VWAP and avoids the lower half of the bands −1/−2, the base-case scenario is continued short absorption and consolidation with an upward bias,” Adler Jr. said.
Adler Jr. also highlighted the futures Pressure Index, which has dropped to 32.5 around quarterly extremes of bearish pressure. The bitcoin spot market, though, continues to show good resilience, the on-chain analyst noted.
Now, investors WOULD need to watch and see if this resilience translates to any real upward momentum in the coming weeks.
Bitcoin Price At A Glance
As of this writing, the price of BTC sits just below $116,000, reflecting no significant movement in the past 24 hours.
