Bitcoin Market Structure Strengthens As Cooling Z-Score Replaces Overheating Peaks

Bitcoin's underlying architecture just flipped from red-hot to rock-solid as key metrics signal sustainable growth ahead.
The Cooling Effect
Z-scores retreat from extreme territory—mathematical proof the market's finding its footing without the speculative frenzy that typically precedes major corrections.
Structural Reinforcement
Institutional flows accelerate while retail FOMO diminishes, creating the rare combination of strong fundamentals without bubble conditions. Wall Street's finally learning what crypto natives knew all along: real value isn't manufactured in boardrooms.
Market maturity meets mathematical inevitability—Bitcoin's not just surviving, it's evolving beyond the boom-bust cycles that make traditional finance guys sweat through their suits.
Bitcoin Z-Score Signals Cooling, Not Weakness
Axel Adler explains that the Z-Score (LTH MVRV, 365d) falling below zero has been widely misunderstood. A negative reading does not mean long-term holders (LTH) are sitting at a loss. In fact, with bitcoin trading near $117,000 and the LTH Realized Price (RP) around $35,000, the aggregate LTH MVRV ratio stands at 3.3. Since values above 1 indicate profit, it is clear that LTH remain in solid gains. The only difference is that the current profit margin is slightly below the 1-year average, creating a signal of cooling rather than overheating.
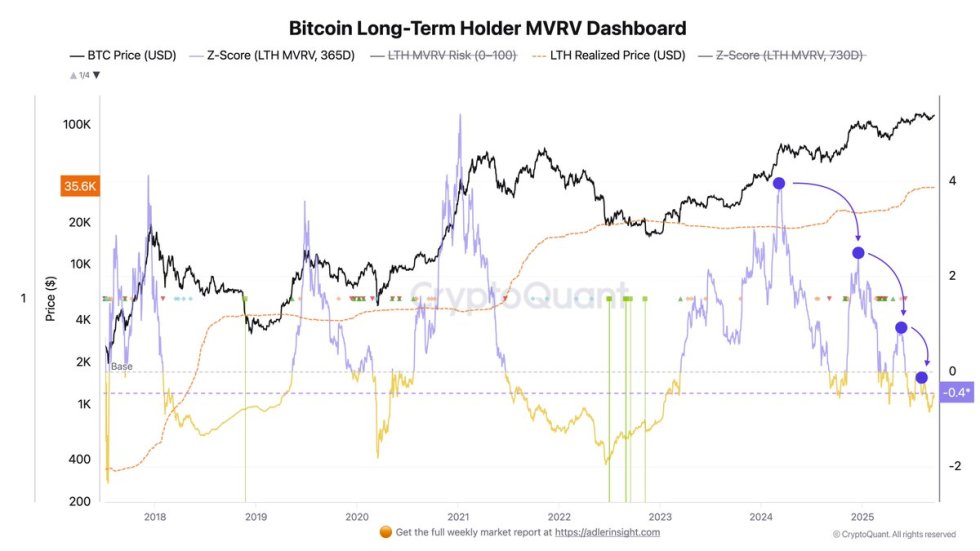
This cooling effect is important because it reflects a healthier market structure. As Adler highlights, the decline in the Z-Score is consistent with fresh demand absorbing older supply, a dynamic that has supported Bitcoin’s trend since it broke above $70,000. Coins purchased at higher prices earlier in the year are now maturing into the LTH cohort, pulling the realized price upward and compressing excess profits. This prevents speculative excess from overheating the market too early.
Historically, sharp Z-Score spikes have coincided with cycle tops, as they reflected aggressive LTH distribution and selling pressure. Now, however, the pattern is changing. Peaks are more diffuse, smaller, and shorter-lived, while new demand entering the market offsets their impact. This suggests a structural evolution where Bitcoin can sustain higher prices without triggering the same overheating conditions as in prior cycles.
In other words, the current Z-Score trend is not a warning signal but rather a sign of resilience. The combination of sustained LTH profits, controlled risk levels, and ongoing new demand points to a supportive backdrop for further continuation, keeping the long-term bullish outlook intact.
Price Analysis: Resistance at $118K Still Intact
Bitcoin (BTC) is currently trading around $116,500 after testing the $117,100–$117,300 area, but it continues to face resistance below the $118K mark. The chart shows that BTC has been in an uptrend since early September, reclaiming the 50-day SMA (blue) and pushing firmly above the 100-day SMA (green), which is now acting as support. The 200-day SMA (red), trending upward, further underlines the medium-term bullish structure.
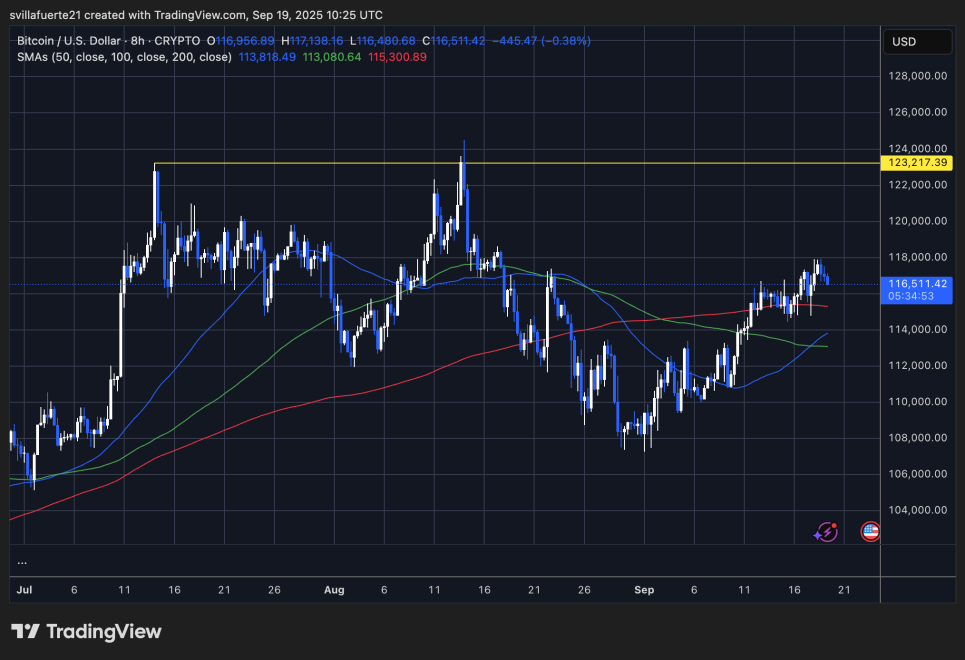
However, the yellow horizontal line at $123,217 highlights the key resistance zone, where Bitcoin has been rejected multiple times since July. The market is consolidating just below this level, suggesting that bulls need stronger momentum to break through. A sustained move above $118K WOULD likely pave the way toward a retest of the $123K–$124K region, and if breached, could open the path toward new all-time highs.
On the downside, initial support lies at $115,300 (200-day SMA on this timeframe), followed by the stronger zone around $113,000. Holding above these levels would preserve the bullish structure.
Featured image from Dall-E, chart from TradingView
