Bitcoin’s Stunning Performance Through September 2025 vs. Historical Cycles – Here’s What’s Truly Different This Time

Bitcoin just shattered every historical comparison—and traditional finance is scrambling to catch up.
The Unprecedented Metrics
Previous cycles followed predictable patterns—this one rewrote the rulebook entirely. Institutional adoption didn't just increase—it exploded. Regulatory clarity finally emerged, turning skeptics into believers almost overnight.
The New Catalysts
Traditional market correlations broke down completely. Bitcoin isn't just outperforming—it's operating in a different dimension altogether. Macroeconomic shifts that used to crush crypto now barely register.
Why This Cycle Defies Comparison
Past performance indicators became virtually useless by mid-2024. The network fundamentals transformed while Wall Street was still debating whether to buy—proving once again that financial institutions move at glacial speed compared to crypto natives.
The trajectory through September 2025 makes previous bull runs look like gentle warm-ups. This isn't just another cycle—it's validation that digital assets have permanently rewritten the financial playbook. Though somehow, the traditional finance crowd will still find a way to call it 'speculative' while missing the next 200% move.
How Bitcoin’s Current Rally Stacks Against Previous Bull Cycle
After hitting multiple all-time highs this year, Bitcoin seems to have stalled as the flagship asset retests key support levels. In the meantime, Joao Wedson, a leading market expert, has shed light on how Bitcoin’s performance up to September 2025 stacks up against its historic cycles.
While outlining BTC’s performance this year to past cycles, the expert is providing a valuable perspective to help investors navigate the market today. Following his analysis of the bitcoin Yearly Seasonality metric, Wedson highlighted that BTC’s action this year up to September has been better than in 2014, 2018, and 2022.
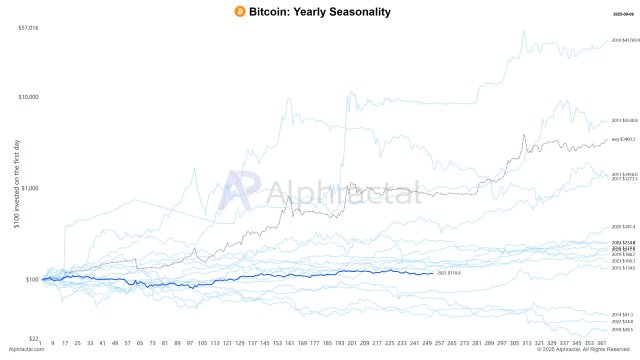
The trend reflects key differences between these years and the current cycle, particularly a more developed market structure, increased institutional engagement, and changing global liquidity dynamics. Bitcoin’s price rally this year may have outperformed the aforementioned years, but recent data on the chart shows it is still worse than in all the other 12 years of its existence.
The expert also outlined how BTC’s ongoing price action in September compares to previous Septembers in the past cycles. BTC’s Monthly Seasonality for September reveals that the flagship asset is performing better this month than the historical average.
Presently, Bitcoin’s price action this month is only lagging behind that of 2012, 2015, 2016, and 2022. As a result, Wedson is pointing to the potential that BTC might not perform as poorly this September as many anticipate.
Support Zones Aligning With On-Chain Metrics
While Bitcoin is holding above the $111,000 price level, CryptoOnchain, a market expert, revealed that the crypto king is currently positioned at one of its most critical support zones in recent years. According to the expert, this level, which is shown on the weekly period as a long-term ascending trendline, represents more than just a straightforward technical support.
It further matches perfectly with the New Whales Realized Price, one of the most important on-chain metrics. As a result of this powerful confluence, an extremely robust defensive zone is created for the market.
Technical analysis suggests that the bullish structure can be rendered invalid if it breaks below this trendline. However, on-chain data indicates that new, large investors have a strong motivation to defend their positions here because this area reflects the average purchase price.
Amid the trend, CryptoOnchain noted that the bearish divergence on the RSI and MACD indicators is casting a shadow for BTC. These divergences hint at a decline in bullish momentum and raise the risk of this support failing.
In the meantime, Bitcoin’s mid-term prospects rely on maintaining or losing this level. A decisive loss of this on-chain and technical support WOULD serve as a powerful sell signal and would cause the market to enter a steep and protracted decline.
