Bitcoin Liquidity Crisis Looms as Stablecoin Growth Plunges to $1.1 Billion

Liquidity drains from crypto markets as stablecoin inflows hit historic lows—just when Bitcoin needs it most.
The $1.1 Billion Reality Check
Stablecoin growth craters to a mere $1.1 billion, slashing market depth and raising volatility risks across exchanges. Trading pairs thin out, spreads widen, and large orders start moving prices—classic signs of liquidity erosion.
Bitcoin bears the brunt. Reduced stablecoin inflows mean fewer on-ramps for fresh capital, forcing BTC to rely on organic demand rather than synthetic dollar inflows. That’s like trying to fuel a rocket with firewood—it might burn, but it won’t escape gravity.
Market makers pull back, algorithmic strategies tighten, and liquidity fragments across venues. Even the usual arbitrage opportunities dry up—no one’s swapping USDT for USDC when both are scarce.
And Wall Street? They’re probably blaming ‘market dynamics’ while quietly shorting volatility. Because nothing says 'financial innovation' like profiting from a liquidity crunch you helped create.
Stablecoin Market Cap Growth Is Significantly Down Compared To Earlier Highs
According to data from on-chain analytics firm CryptoQuant, stablecoin growth has been cooling recently. “Stablecoins” refer to cryptocurrencies that have their price tied to a fiat currency, with US Dollars being the most popular option.
Investors generally store their capital in the form of these tokens when they want to avoid the volatility that comes with coins like Bitcoin. Many holders who buy into stables, however, eventually plan to venture back into the volatile side of the market. Since stablecoins can potentially be swapped into BTC and other assets, their supply can be looked at as a sort of available “dry powder” for the cryptocurrency sector. As such, expansions in this supply can prove to be a bullish sign.
Now, here is the chart shared by CryptoQuant that shows the trend in the 7-day change in the market cap of the major USD-based stables over the past year:
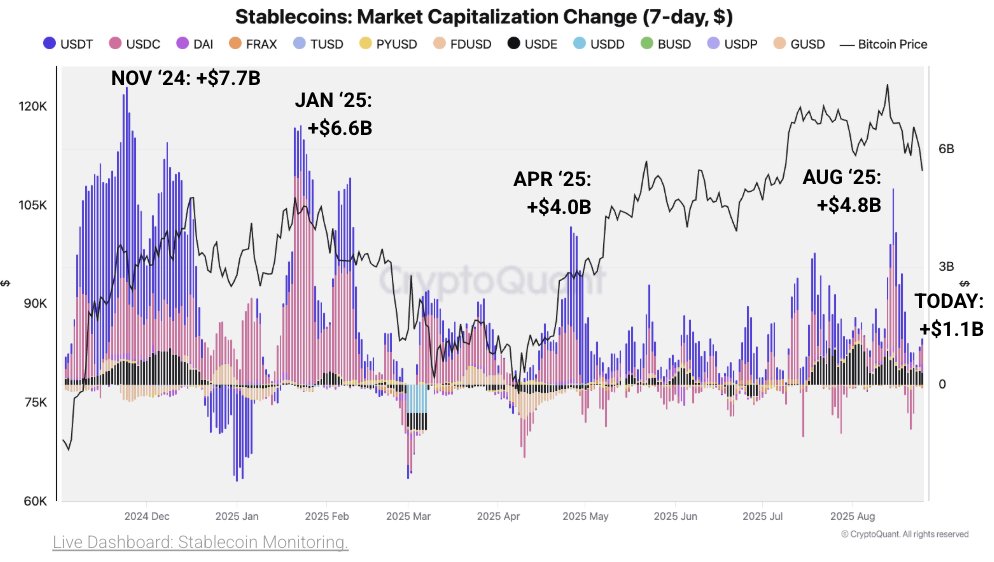
As displayed in the above graph, the late 2024 bull run was accompanied by a sharp positive change in the market cap of the stablecoins. At the peak, these assets observed weekly net inflows of around $7.7 billion. Another wave of inflows occurred in January of this year, with the metric peaking at $6.6 billion. Since then, the market has seen a cooldown in interest, with inflows into stables staying far from the earlier highs.
From the chart, it’s visible that the sharp burst in capital flows earlier this month could only manage a top of $4.8 billion. The interest also lasted quite briefly, and inflows disappeared soon after. At present, the metric is sitting at $1.1 billion, implying the market cap of the stablecoins is still growing, but clearly, the rate at which it’s happening isn’t close to the previous bull rally.
“Liquidity tailwinds are weaker, limiting Bitcoin’s upside momentum,” explains the analytics firm. It now remains to be seen how long the muted stablecoin inflows WOULD last and whether a pivot to outflows would follow next.
In some other news, the Relative Unrealized Loss held by bitcoin investors is still quite low even after the latest price decline, as on-chain analytics firm Glassnode has pointed out in an X post.
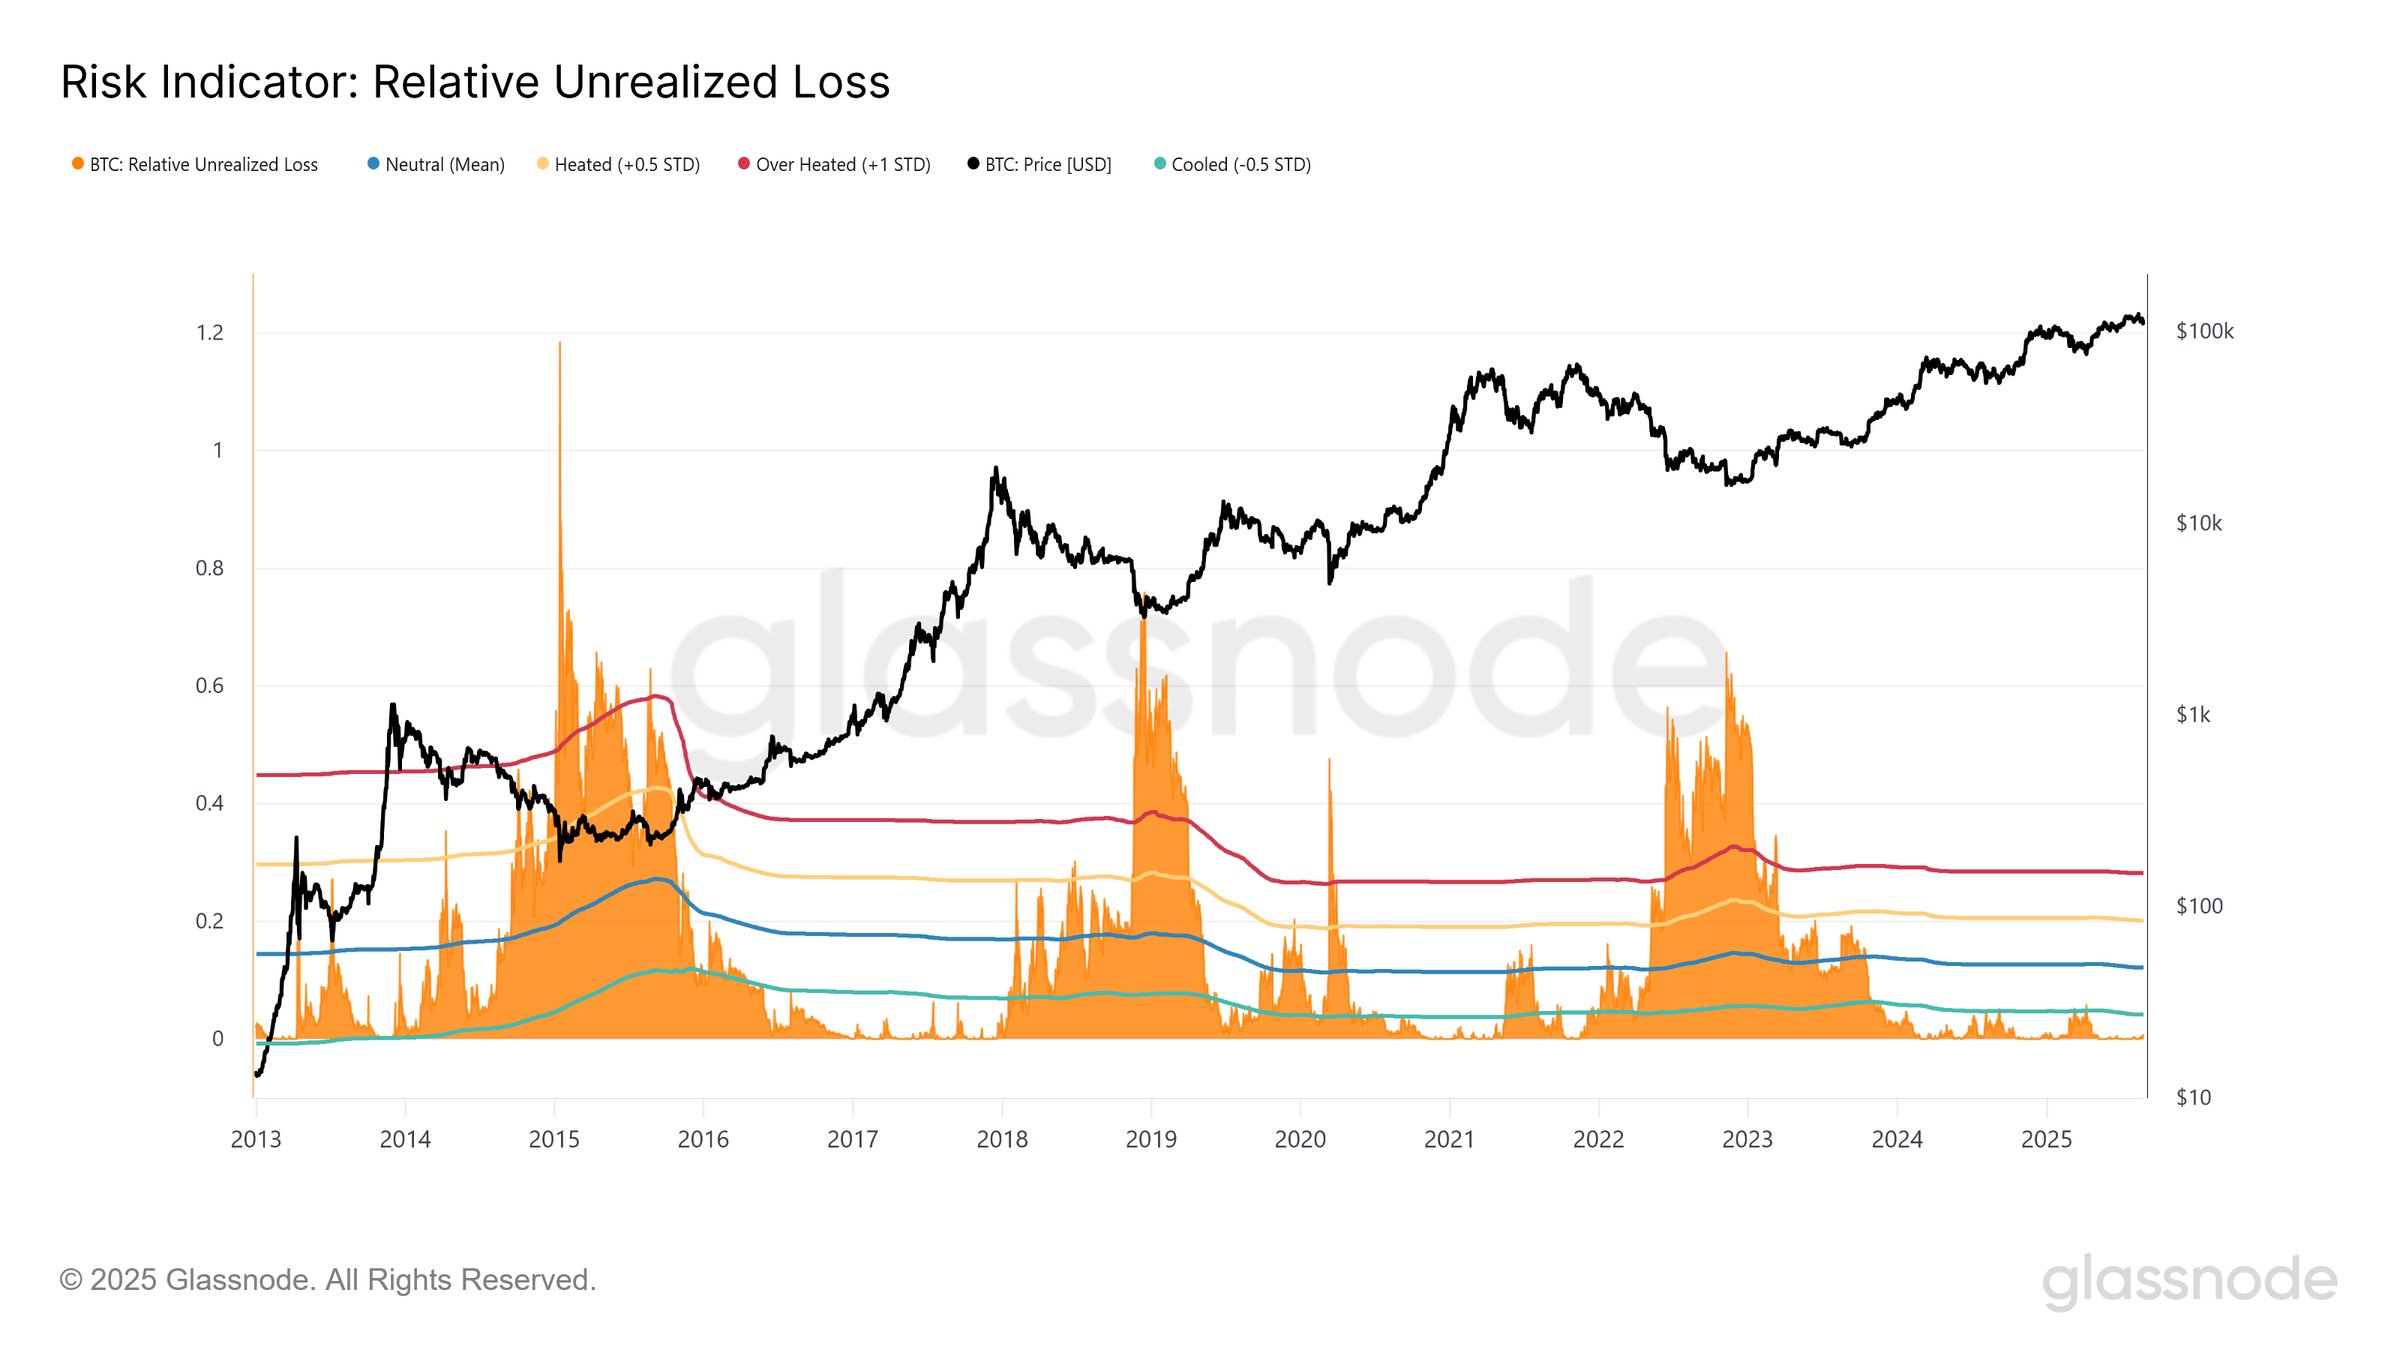
The Relative Unrealized Loss is a measure of the total unrealized loss held by the Bitcoin investors represented as a percentage of the market cap. At present, the metric’s value stands at just 0.5%, which is quite low compared to past bear markets.
BTC Price
At the time of writing, Bitcoin is floating around $113,400, up almost 2% over the 24 hours.
